The analysis of adolescents in this report is based on a self-administered web survey conducted from March 29 to April 14, 2019, among a sample of 1,811 dyads, with each dyad – or pair – comprised of one U.S. adolescent ages 13 to 17 and one parent per adolescent. The margin of sampling error for the full sample of 1,811 teens is plus or minus 3.1 percentage points.
The survey was conducted by Ipsos in English and Spanish. Ipsos sampled households with adolescents ages 13 to 17 from its KnowledgePanel, a probability-based web panel designed to be representative of the United States. A parent panelist and one teen ages 13 to 17 in the household participated. Households were provided with access to the internet and hardware if needed.
 A random sample of 4,588 panel members with children ages 13 to 17 in their homes was drawn from the KnowledgePanel. Of the sampled panelists, 2,176 (excluding breakoffs) responded to the invitation and 1,819 qualified for the survey,18 yielding a study completion rate of 47.4% and a qualification rate of 83.6%. The recruitment rate for this study, reported by Ipsos, was 11.5% and the profile rate was 59.7%, for a cumulative response rate of 3.3%. Once the parent panelist qualified, they were asked for permission to interview their teen upon the completion of the parent portion of the survey. When the parent portion was complete, the parent was instructed to hand the survey off to the teen they had previously been asked about.
KnowledgePanel’s recruitment process was originally based exclusively on a national random-digit dial (RDD) sampling methodology. In 2009, Ipsos migrated to an address-based sampling (ABS) recruitment methodology via the U.S. Postal Service’s Delivery Sequence File (DSF). The U.S. Postal Service’s Delivery Sequence File has been estimated to cover as much as 98% of the population, although some studies suggest that the coverage could be in the low 90% range.19
Weighting
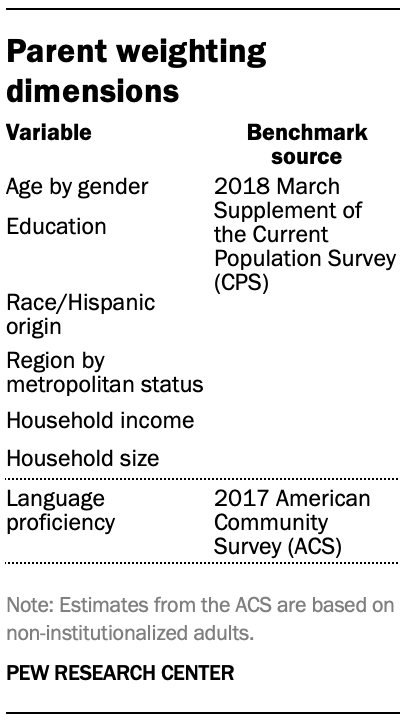
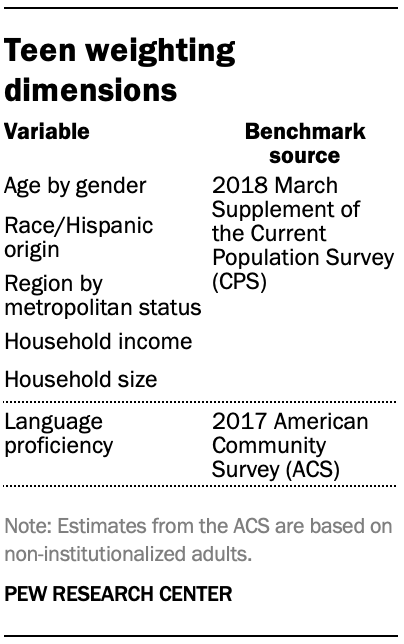 The teen data was weighted in a multistep process that begins with base design weights that reflect each parent’s probability of selection. These parent weights were then raked to match the demographic distribution of parents with teens ages 13 to 17. The teen weights were then further adjusted to reflect each teen’s probability of selection out of all eligible teens in their household. Finally, the weights were raked to match the demographic distribution for all teens ages 13 to 17.
Sampling errors and tests of statistical significance take into account the effect of weighting.
In addition to sampling error, one should bear in mind that question wording and practical difficulties in conducting surveys can introduce error into the findings of opinion polls.
The following tables show the unweighted sample sizes and the error attributable to sampling that would be expected at the 95% level of confidence for different groups in the survey:
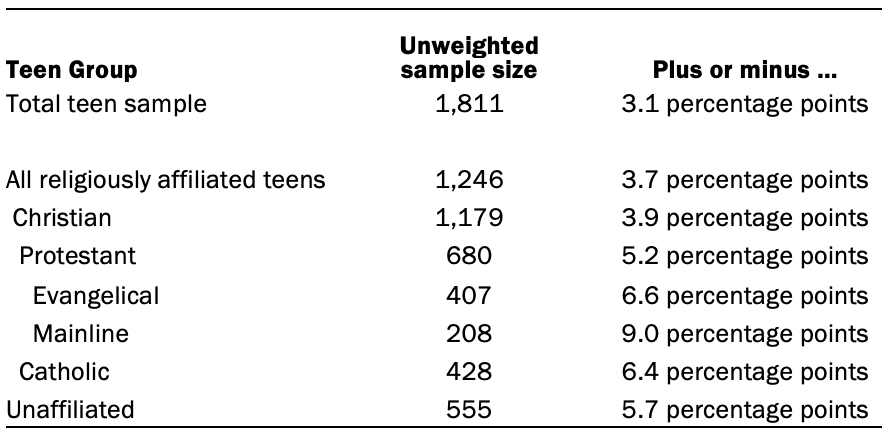

Sample sizes and sampling errors for other subgroups are available upon request.
© Pew Research Center, 2019
