Household income varies among Black immigrant origin groups
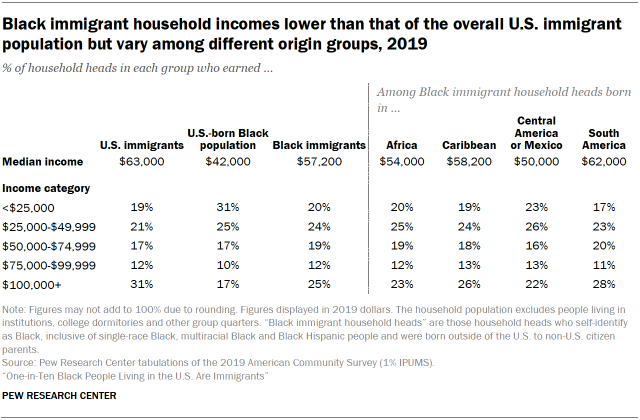
In 2019, Black immigrant-headed households had a lower median income than U.S. immigrant-headed households overall, but a higher median income than households headed by members of the U.S.-born Black population. This pattern has persisted since 2000. That year, the overall immigrant household population’s median income was $58,600, while the Black immigrant household population’s median was $54,700 and the U.S.-born Black household population’s median was $42,500.
The median household income for Black immigrants has slightly increased since 2000 but at a slower pace than that of the overall immigrant population. In 2019, the median household income for the Black immigrant population was $57,200 – lower than the $63,000 U.S. immigrant population household income in 2019 but still higher than the median income in 2000 ($54,700).4 The median income for the entire U.S. immigrant household population increased from 2000 to 2019 ($58,600 to $63,000). When it comes to distribution of income, the overall immigrant population also had a slightly higher share of households earning $50,000 and higher than the Black immigrant population in 2019 (60% vs. 56%).
The household income distribution, however, has changed little since 2000 for the overall Black immigrant population. In 2000 and 2019, similar shares of Black immigrant-headed households (46% and 44%, respectively) made less than $50,000 in 2019 dollars. Roughly three-in-ten in both 2000 and 2019 made $50,000 or more but less than $100,000. The share of Black immigrant households making $100,000 or more was also similar in both 2000 and 2019 (22% and 25%, respectively).
In 2019, household incomes of Black immigrants also differed by region of origin. Households where the household head was born in South America had the highest median income of this population, at $62,000 – the highest among the Black immigrant household population. The median income was next highest among Caribbean-born households ($58,200), followed by those born in Africa ($54,000) and Central America or Mexico ($50,000). Roughly half or more of households headed by someone born in the Caribbean (57%), Africa (55%), South America (59%) and Central America or Mexico (51%) earned at least $50,000 in 2019.
Similar shares of Black immigrants and U.S. immigrants lived below poverty line
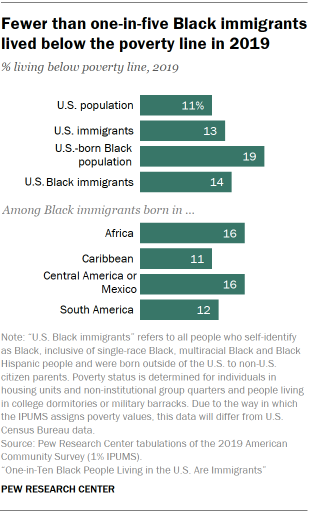
Some 14% of Black immigrants lived below the poverty line in 2019 (before the COVID-19 pandemic), a rate below that of U.S.-born Black Americans (19%) but higher than the poverty rate among the entire U.S. population (11%).
Roughly similar shares of Black immigrants and all U.S. immigrants lived below the poverty line (14% and 13%, respectively).
Poverty rates within the Black immigrant population vary slightly by region. Fewer than one-in-five African-born (16%) and Central American- or Mexican-born Black immigrants (16%) live below the poverty line, as do 11% and 12% of Caribbean- and South American-born Black immigrants, respectively.
Black immigrant households less likely than overall U.S. immigrant household population to own their homes
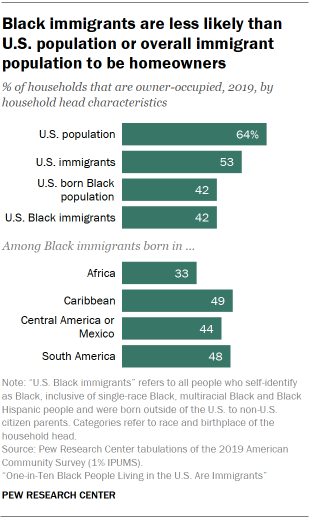
Roughly four-in-ten Black immigrant-headed households (42%) owned their homes in 2019, which matches the rate of home ownership among U.S.-born Black Americans (based on heads of households). However, this share is slightly lower than rate of homeownership among all immigrants (53%) and among the entire U.S. population (64%).
The rate of home ownership varies among Black immigrants from different parts of the world. In 2019, a third of African-born immigrant households owned their homes, while around half of Caribbean immigrant households (49%) owned their homes.


