The South has the largest share of the Black foreign-born population
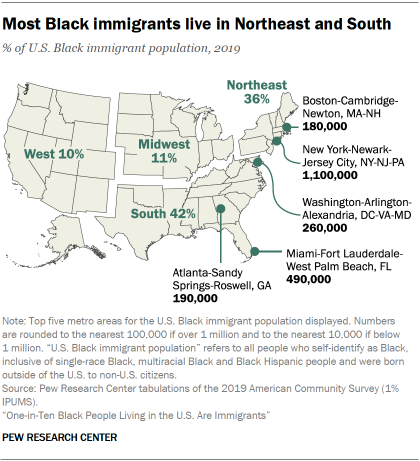
The vast majority of Black immigrants in 2019 lived in either the Northeast or the South (79%). That year, the South was the region with the highest share of the country’s Black immigrant population, with 42% living there. The Northeast had the second-highest share (36%) of the Black immigrant population, while the West and Midwest were each home to roughly one-tenth of this population.
Black migrants from different regions of the world settle in different regions of the U.S. For example, the American South was home to the largest share of African-born migrants in 2019 (40%), while roughly one-in-five settled in either the Midwest (22%) or Northeast (20%) and 17% lived in the West. Caribbean-born Black immigrants largely lived in either the Northeast (48%) or the South (47%), with just 3% living in the Midwest and Western regions of the U.S.
Since 2000, the share of African-born Black immigrants who reside in the South has remained about the same, while the share of Caribbean-born Black immigrants who reside in the South has increased by 10 percentage points. The share of Caribbean-born Black immigrants who reside in the Northeast has also fallen over time – in 2000, a 58% majority lived in that region, which dropped to 48% in 2019.
While the populations of Black immigrants in the South, Midwest and West have each at least doubled between 2000 to 2019, the population of Black immigrants in the Northeast has seen a more modest growth of about 41% over the same time span.
More Black immigrants live in New York and Florida than anywhere else in the country
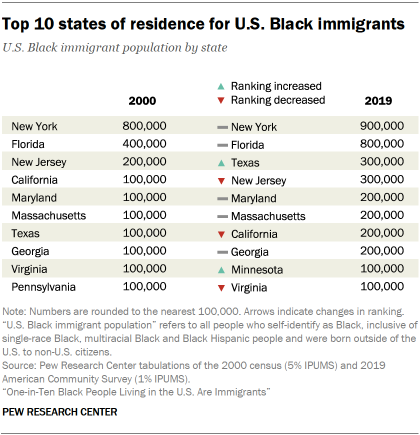
With roughly 900,000 Black immigrants in 2019, New York is home to the largest Black immigrant population in the country and has been since 2000. Florida is home to the second largest population, with roughly 800,000 in 2019. Texas, New Jersey, Maryland and Massachusetts round out the top five states of residence.
Together, the top 10 states of residence for U.S. Black immigrants in 2019 were home to roughly three-quarters of the entire Black immigrant population in the U.S.
In terms of metropolitan areas, New York City has the largest Black immigrant population, with roughly 1.1 million Black immigrants in 2019. The Miami metropolitan area is the second most populous for Black immigrants, with roughly 490,000. The Washington, D.C., area is third for Black immigrants, with a population of roughly 260,000. The Atlanta, Boston, Houston and Dallas areas are among the other top metropolitan areas for Black immigrants in the country.
Some metropolitan areas hold sizable populations of specific nationalities. For example, roughly 260,000 Black Jamaican immigrants live in the New York City metropolitan region as of 2019, equaling 35% of all foreign-born Black Jamaicans in the U.S. The Miami metropolitan area is also home to the nation’s largest Black Haitian immigrant community – more than 35% of Black Haitian immigrants live in this area and account for 4% of the metropolitan area’s population. And roughly 20% of all Ethiopian-born Black immigrants live in the Washington area.
Colorado is the fastest-growing state for Black immigrants in 2019
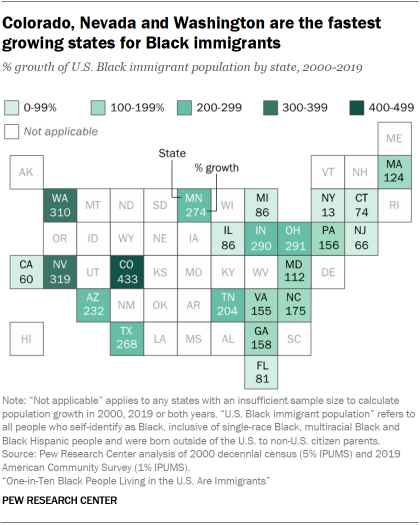
Certain states have seen significant growth in their Black immigrant populations since 2000. The state with the fastest growth of the Black immigrant population included in this analysis is Colorado, with over 400% growth from 2000 to 2019, much larger than the state’s general population growth of 34% over the same period.3 Washington, Nevada, Indiana, Ohio, Texas and Minnesota also saw over 250% growth since 2000. Arizona, Tennessee, North Carolina, Georgia, Pennsylvania, Virginia, Maryland and Massachusetts have all seen growth of over 100% for Black immigrants.
Many of the fastest-growing states started off this period with smaller Black immigrant populations. Colorado and Indiana, for example, had Black immigrant populations of less than 10,000 in 2000, but these figures more than doubled by 2019.
The states with the largest shares of Black immigrants, by contrast, might have had lower growth rates over this period but still saw large population growth. New York state’s Black immigrant population growth rate was the lowest among the top 10 states of residence, at just 13%, but the number of Black immigrants increased by almost 110,000. And while Florida’s Black immigrants saw 81% growth from 2000 to 2019, the number living there increased by over 350,000 – making the growth in Florida’s Black immigrant population larger than the entire 2019 Black immigrant populations of Colorado, Arizona, Washington, Nevada, Indiana and Ohio combined.
There has been corresponding population growth in metropolitan areas in the states that experienced significant population growth from 2000 to 2019. In Texas, for example, the Dallas-Fort Worth and Houston-Sugar Land metropolitan areas have seen over 200% growth since 2000. The Minneapolis-St. Paul area in Minnesota has also seen a 249% growth. Other metropolitan areas with notably high population growth rates include Orlando (166%), Atlanta (165%), Philadelphia (121%) and Boston (104%).


