These findings are excerpted from a previously released report “As Debt Limit Deadline Nears, Concern Ticks Up But Skepticism Persists,” published October 15, 2013. For findings related to the shutdown and debt limit debate, views of the parties and party leaders and information about the survey and survey topline, see the full report.
Amid protracted partisan conflict in Washington, 81% say they are dissatisfied with the way things are going in the United States, while just 14% are satisfied. The percentage saying they are satisfied with the state of the nation has fallen 13 points since July and is now at its lowest level since the financial crisis in late 2008.
 The grim public mood is reflected in the record share of voters who want most members of Congress defeated in next year’s midterm elections. A national survey by the Pew Research Center, conducted Oct. 9-13 among 1,504 adults, finds that nearly three-quarters (74%) of registered voters would like to see most members of Congress defeated; during the 2010 and 2006 election cycles, which both culminated in shifts in control of the House, no more than 57% in each of these two cycles wanted most members of Congress not to be reelected.
Moreover, the share saying they do not want their own representative reelected – 38% – is as high as it has been in two decades. At this stage in the 2010 and 2006 midterms, fewer wanted to see their own member of Congress defeated (29% in November 2009, 25% in September 2005).
Early Look at 2014 Midterm
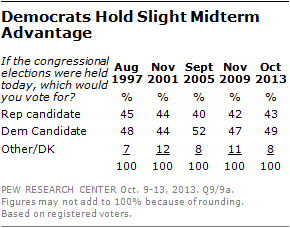 An early read of voter preferences for the 2014 midterm shows that the Democrats have a six-point edge: 49% of registered voters say they would vote for or lean toward voting for the Democratic candidate in their district, while 43% support or lean toward the Republican candidate.
 In November 2009, a year before the Republicans won a House majority, Democrats held a five-point edge (47% to 42%). In September 2005, 14 months before the Democrats won a House majority for the first time in more than a decade, Democrats held a 12- point lead (52% to 40%).
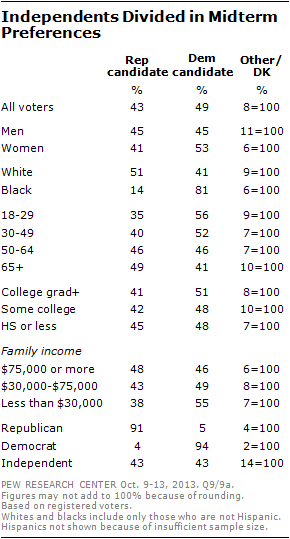
On the 2014 generic ballot, the parties run well among their traditional bases of support. There is higher support for Democratic candidates among blacks, women and younger Americans.
Republicans run relatively well among white voters, older voters and those with family incomes of $75,000 a year or more.
At this early stage, independent voters are evenly divided: 43% say that if the elections for Congress were being held today, they would vote for the Republican candidate in their district, 43% say they would vote for the Democratic candidate.
Large Majority Wants Most Congressional Incumbents Out
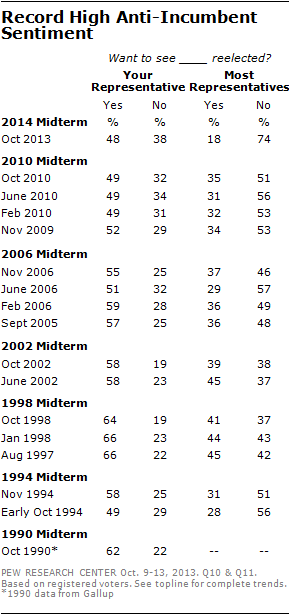 Americans express clear frustration with congressional incumbents. A record-high 74% of registered voters now say that most members of Congress should not be reelected in 2014 (just 18% say they should). By comparison, at similar points in both the 2010 and 2006 midterm cycles only about half of registered voters wanted to see most representatives replaced.
Historically, voters have been more positive about reelecting their own members of Congress than members as a whole, and that remains the case today. Even so, just 48% of voters say their own member of Congress should be reelected, while 38% say he or she should be replaced. That is as negative a balance on this question as at any point in the last two decades.
A year ahead of the 2010 midterm – an election in which 58 incumbents went on to lose reelection bids, the most in more than a half-century – 29% wanted their own representative to be defeated; 38% say that today.
 Democratic voters are slightly more likely than Republicans to say that their own representative should be reelected: 47% of Republican voters and 54% of Democratic voters favor their own representative’s reelection, as do 43% of independent voters.
By contrast, in 2009, when Democrats controlled both houses of Congress as well as the presidency, fully 64% of Democratic voters wanted to see their member of Congress reelected, compared with 50% of Republican voters. In 2006, when Republicans held the Senate, the House and the White House, 70% of GOP voters wanted to see their member remain in office, while just 53% of Democrats did.
Views of the Parties: Traits and Issues
The Democratic Party continues to be viewed more favorably than the Republican Party: 47% of adults have a favorable opinion of the Democratic Party while 38% view the GOP favorably. (For more on party favorability, see the full report).
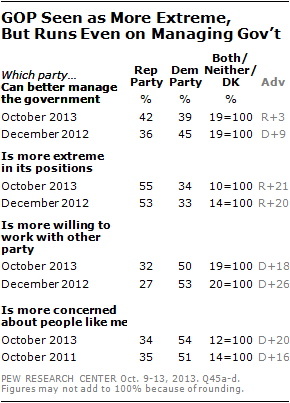 But while the GOP is viewed less favorably than the Democratic Party and Republicans receive more blame for the shutdown, there is little sign that the GOP has hurt its position relative to Democrats on a range of traits and issues.
Overall, 42% view the Republican Party as better able to manage the federal government, while about as many (39%) say the Democratic Party is better described this way. In December 2012, the Democratic Party held a 45%-36% advantage over the GOP as the party seen as better able to manage the government.
The Democratic Party continues to be seen as more willing to work with the opposing party than Republicans (50%-32%), and far more say the GOP is more extreme in its positions than the Democratic Party (55%-34%). However, on both of these measures, the Republican Party’s standing is not significantly different than it was in December of 2012.
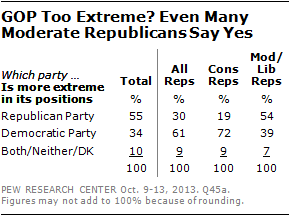 There is a divide within the GOP when it comes to which party is more extreme in its positions. Overall, 61% of Republicans say the Democratic Party is more extreme in its positions, 30% say the GOP is more extreme. However, among moderate and liberal Republicans, 54% call their own party more extreme in its positions, just 39% say the Democratic Party takes more extreme positions. By contrast, conservative Republicans view the Democratic Party as more extreme by a 72%-19% margin.
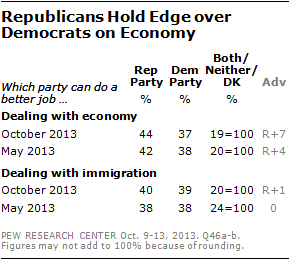 When it comes to the key issue of dealing with the economy, slightly more say the Republican Party (44%) than the Democratic Party (37%) could do the better job. Independents favor the GOP on the economy by a 46%-30% margin.
The public is divided over which party can better handle immigration: 40% say the Republican Party could do the better job dealing with immigration, 39% say the Democratic Party.
Click here for information about the survey
Click here for survey topline.


