 Last week’s historic split in the House of Labor was driven, at least in part, by disagreements over whether the AFL-CIO should be focusing more on union organizing drives or electoral politics.
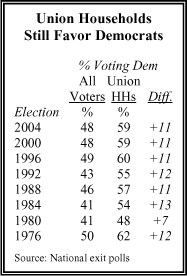
Much is at stake, not just for the union movement but also for the political parties. Working class voters are a key swing constituency, and in recent years the Republicans have made significant gains among this economic group, even as the Democrats have retained their strong support from labor union members and their immediate families.
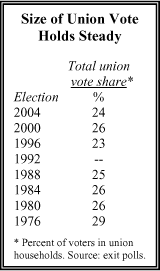
Today, just 12.5% of the workforce belongs to a union; the rate was more than twice as high when the AFL-CIO was founded 50 years ago. But the union vote carries more political clout than the sharp decline in overall membership suggests. Since 1980 about one-in-four voters on election day belonged to a household that included a union member, and there is no sign that this percentage is declining.
 But while the union vote remains a key part of the Democratic base, the economic class from which most union members are drawn has become a growth area for Republicans. Indeed, a review of relevant data suggest that the age-old political axiom — Democrats are the party of the working class; Republicans are the party of the well-to-do — could stand a little updating.
A new Pew Research Center analysis of national public opinion surveys conducted since 1992 — some 129 surveys with more than 200,000 respondents — has found that at the broadest level, the axiom still holds. It remains true now, as it was in 1992, that the more income a person has, the more likely he or she is to be a Republican, and the less income a person has, the more likely he or she is to be a Democrat.
 But the analysis also yielded a couple of significant qualifiers. First, when it comes to explaining partisan affiliation, income is a relatively weak demographic indicator. It is only about half as important as church attendance, and just a third as important as race.
Second, even though there hasn’t been much change since 1992 in party identification at the top and bottom of the income curve, there has been some significant pro-Republican movement in the middle. Indeed, among whites, Republicans now enjoy a clear edge over Democrats not just in the upper income brackets, but also in the middle bracket and have made gains even in the lower-middle income bracket. These income groups contain the people who are either union members or likely targets of membership drives. They also typically contain many swing voters who decide close elections.
Party Breakdown By Quintile:
 Upper Income Quintile (Annual household income above approx. $92,000, in 2005 dollars): In 2005, the GOP edge over Democrats among people in this income bracket is 38%-27% (with the remainder unaffiliated with either major party); back in 1992, the GOP edge was nearly identical, 37%-26%.
Upper Middle Income Quintile (Annual household income of approx. $58,000 to $92,000): The Republicans have a small edge over Democrats among all people in this bracket, 36%-31%, and a larger edge among whites, 40%-27%. Back in 1992, the GOP’s margins were smaller among all people (32%-29%) and among whites (34%-26%).
Middle Income Quintile (Annual household income of approx. $35,000 to $58,000): Among whites in this bracket, Republicans have opened up an 8 percentage point margin over Democrats (36%-28%), up from the 4 percentage point margin the GOP enjoyed in 1992 (32%-28%). When nonwhites are included, the overall public in this income range is divided almost evenly (33% Democrat, 32% Republican).
Lower Middle Income Quintile (Annual household income of approx. $19,000 to $35,000): Here is where the GOP gains have been strongest. Republicans still trail Democrats among all people in this bracket by 35%-28%, but the GOP now leads among whites in this bracket, by a slim 33%-29%. Back in 1992, the Democrats led the GOP among whites by 33%-28% and among all people by 38%-24%.
Lower Income Quintile (Annual household income below approx. $19,000): Republicans continue to trail by sizable margins in this income bracket. Currently the Democrats enjoy a 42%-20% advantage overall, comparable to their 43%-18% edge in 1992. Among whites, the Democratic edge is 37%-24% now and had been 37%-22% back in 1992.
These Republican gains among whites in the middle brackets aren’t limited to partisan identification. They also were a factor in helping Bush to his 51%-48% popular vote reelection victory.
According to last year’s election day exit poll, Bush carried the overall white vote by 58%-41%, while Sen. John Kerry captured the black vote by 88%-11%. That survey also separated voters into eight brackets of family income. It showed that Bush carried the white vote in seven of these eight brackets (all but the poorest) — and that he won by significant margins (see table) in six of the eight brackets, including by a 17 percentage point edge among whites with annual incomes of $30,000-$49,999.
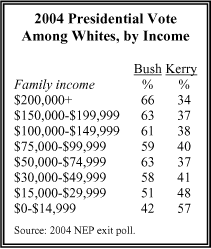 It’s instructive to compare Bush’s supporters in 2004 with Ronald Reagan’s supporters two decades earlier. In winning landslide victories in 1980 and 1984, Reagan, like Bush, ran extremely well among middle and working class whites. The difference is that, back then, these voters were dubbed “Reagan Democrats.” A generation later, fewer of these working class voters needed to break free of their partisan allegiances in order to vote for Bush. Many were already Republicans.
Of course, presidential votes are determined by many factors beyond partisan allegiances — among them, the character of the candidates, the state of the economy, and the issue agenda of the campaign. For that reason, people are more prone to switch back and forth in their presidential vote than in their partisan self-identification.
A Longer Sweep of History
However, partisan allegiances also change — and over time, they can change a great deal. In the 1960s and 1970s, Democrats enjoyed as much as a two-to-one edge over Republicans in party identification, largely on the strength of the “big tent” coalition their party had assembled during the long presidency of Franklin Roosevelt. But by the end of the 1980s, President Reagan had helped to build a modern big-tent Republican Party that wiped out most of the earlier Democratic dominance.
The two parties have been closely matched ever since, with Democrats generally enjoying a small single-digit advantage over the GOP during the past decade and a half — in Pew’s July, 2005 survey, for example, 34% of respondents said they were Democrats, 31% Republicans and 29% Independents.
Just as these partisan allegiances have changed significantly over the longer sweep of history, so too have the relationships between party and income. A team of researchers led by Nolan McCarty of Princeton University has analyzed National Election Study survey data from 1952 to 2000 and found that there was much more partisan stratification by income at the end of that period than there had been at the beginning.
The biggest reason, they note, was the shift in the political alignment of Southern voters. In the 1950s, Southern whites of all income levels were among the most loyal Democrats in the country; they were still voting the way great-granddaddy shot in the Civil War. Meantime, blacks (almost all of whom were poor) were politically cross-pressured. Many were drawn to the Democrat Party by the policies of Franklin Roosevelt, but many others retained their ancestral loyalties to the Republican Party of Abraham Lincoln.
The Civil Rights movement of the 1960s changed all that; blacks became nearly monolithically Democratic and Southern whites turned heavily Republican. Both these changes, in turn, contributed to a rise in partisan stratification by income.
Analyzing NES data, McCarty found that in the elections of 1956 and 1960, respondents in the highest income quintile were hardly more likely to identify as Republicans than were respondents in the lowest quintile. But by the elections of 1992 and 1996, those in the highest quintile were twice as likely as those in the lowest to call themselves Republicans. Pew’s 2000 and 2004 election year surveys show that this pattern has persisted.
In short, the familiar “Republicans are rich/Democrats are poor” stereotype is much more true now — at least at the extremes of the income curve — than it was a half century ago when the AFL-CIO was founded. However, when it comes to partisanship and income, the key battleground in American politics is in the middle brackets. And there, after a long slow climb that has occurred mostly in the past two decades, the GOP has reached parity with the Democrats.
Increase in Income Inequality
During the past half century, there has also been another significant change — an overall increase in income inequality. Economists disagree on its magnitude (mostly because there is a running dispute among economists over whether to count certain non-cash benefits, such as Medicaid and Medicare, in measuring household income), but virtually everyone agrees on the basic facts. In relative terms, the rich are richer, and everyone else is poorer, now than they were a generation and two generations ago.
More of the change has occurred at the top than at the bottom. According to the Census Bureau, the wealthiest quintile of households received 49.8% of all personal income in 2003; up from 43.8% in 1967, while the poorest quintile received 3.6% in 2003, down from 4% in 1967. The middle quintile received 14.8% in 2003, down from 17.3% in 1967.
However, McCarty found that this increase in income inequality has not played a significant role in the increase is partisan stratification by income. The modern history of presidential politics tends to bear out his analysis. Despite the substantial growth in relative income that the wealthy have enjoyed over the past two decades, the bash-the-rich politics of class resentment have not resonated with the electorate in the presidential campaigns waged during this era.
Where Income Rates
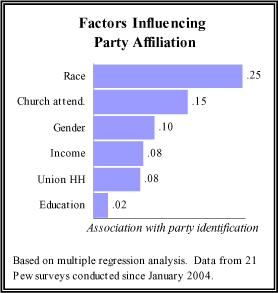 Indeed, when it comes to explaining partisanship, income is not nearly as powerful a factor as the familiar stereotype would suggest. To find out its relative influence, Pew conducted a multiple regression analysis of survey data it has collected on party identification since January of 2004. This is a statistical technique that measures the relative impact of each of a set of factors on a phenomenon of interest.
The analysis (see table) shows that of six demographic traits often linked to partisanship, race is the most influential driver of party identification, and frequency of church attendance is the second most important. Income, union membership and gender are of roughly equal importance, and education is least important.
The Labor Union Conundrum
The question at the heart of the labor movement’s schism is essentially a strategic one: Is it better to invest marginal resources in organizing drives to bring in new union members, or in get-out-the-vote drives to help elect pro-labor candidates?
Only the unions themselves can answer that question, but the data show that both approaches have grown more challenging over time. The sharp decline in union membership speaks to the inhospitality of the modern economy to the labor movement. And the growth in GOP identification among people in the middle income brackets suggests the difficulties in mobilizing such voters for pro-labor candidates.
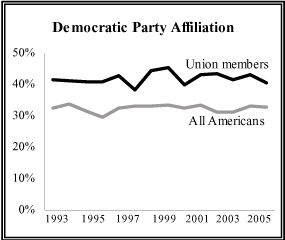
But in the face of both of these changes, the data also make one more thing clear: the labor movement has done a very good job of getting those members it has to the polls, and keeping them loyal to the Democratic Party.


