Methodology
Survey conducted January 4-9, 2017
Most of the analysis in this report is based on telephone interviews conducted January 4-9, 2017 among a national sample of 1,502 adults, 18 years of age or older, living in all 50 U.S. states and the District of Columbia (376 respondents were interviewed on a landline telephone, and 1,126 were interviewed on a cell phone, including 674 who had no landline telephone). The survey was conducted by interviewers at Princeton Data Source under the direction of Princeton Survey Research Associates International. A combination of landline and cell phone random digit dial samples were used; both samples were provided by Survey Sampling International. Interviews were conducted in English and Spanish. Respondents in the landline sample were selected by randomly asking for the youngest adult male or female who is now at home. Interviews in the cell sample were conducted with the person who answered the phone, if that person was an adult 18 years of age or older. For detailed information about our survey methodology, see https://legacy.pewresearch.org/methodology/u-s-survey-research/
The combined landline and cell phone sample are weighted using an iterative technique that matches gender, age, education, race, Hispanic origin and nativity and region to parameters from the 2015 Census Bureau’s American Community Survey and population density to parameters from the Decennial Census. The sample also is weighted to match current patterns of telephone status (landline only, cell phone only, or both landline and cell phone), based on extrapolations from the 2016 National Health Interview Survey. The weighting procedure also accounts for the fact that respondents with both landline and cell phones have a greater probability of being included in the combined sample and adjusts for household size among respondents with a landline phone. The margins of error reported and statistical tests of significance are adjusted to account for the survey’s design effect, a measure of how much efficiency is lost from the weighting procedures.
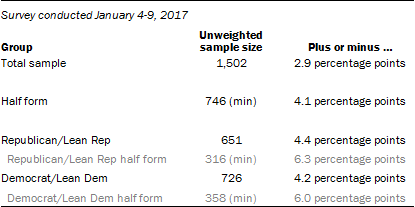
The following table shows the unweighted sample sizes and the error attributable to sampling that would be expected at the 95% level of confidence for different groups in the survey:
Survey conducted January 5-8, 2017
Additional analysis in this report is based on telephone interviews conducted January 5-8, 2017 among a national sample of 1,003 adults, 18 years of age or older, living in the continental United States (503 respondents were interviewed on a landline telephone, and 500 were interviewed on a cell phone, including 317 who had no landline telephone). The survey was conducted by interviewers at Princeton Data Source under the direction of Princeton Survey Research Associates International. A combination of landline and cell phone random digit dial samples were used; both samples were provided by Survey Sampling International. Interviews were conducted in English and Spanish. Respondents in the landline sample were selected by randomly asking for the youngest adult male or female who is now at home. Interviews in the cell sample were conducted with the person who answered the phone, if that person was an adult 18 years of age or older. For detailed information about our survey methodology, see https://legacy.pewresearch.org/methodology/u-s-survey-research/
The combined landline and cell phone sample are weighted using an iterative technique that matches gender, age, education, race, Hispanic origin and region to parameters from the 2015 Census Bureau’s American Community Survey and population density to parameters from the Decennial Census. The sample also is weighted to match current patterns of telephone status (landline only, cell phone only, or both landline and cell phone), based on extrapolations from the 2016 National Health Interview Survey. The weighting procedure also accounts for the fact that respondents with both landline and cell phones have a greater probability of being included in the combined sample and adjusts for household size among respondents with a landline phone. The margins of error reported and statistical tests of significance are adjusted to account for the survey’s design effect, a measure of how much efficiency is lost from the weighting procedures.
The following table shows the unweighted sample sizes and the error attributable to sampling that would be expected at the 95% level of confidence for different groups in the survey:

Sample sizes and sampling errors for other subgroups are available upon request.
In addition to sampling error, one should bear in mind that question wording and practical difficulties in conducting surveys can introduce error or bias into the findings of opinion polls.
Pew Research Center is a nonprofit, tax-exempt 501(c)(3) organization and a subsidiary of The Pew Charitable Trusts, its primary funder.

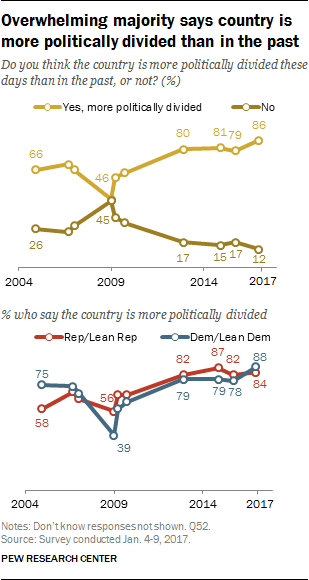 For more than a decade, majorities have routinely described the nation as increasingly divided. But the current share expressing this view is the highest it has been at any point since the question was first asked in 2004.
The current mood stands in stark contrast to January 2009, before Barack Obama took office. At that time, just 46% said the nation was more politically divided. But a few months into Obama’s first term, the share saying the country was more divided politically had risen to 61%.
The nature of the country’s political divisions is a rare point of partisan agreement: Comparable majorities of Democrats and Democratic leaners (88%) and Republicans and Republican leaners (84%) say the country is more divided these days than in the past.
The latest national survey by Pew Research Center, conducted Jan. 4-9 among 1,502 adults, finds little optimism that the country’s political divisions will subside any time soon: 40% expect the country to be about as politically divided in five years as it is today, while 31% think it will be even more divided; just 24% expect divisions to lessen.
In the wake of Trump’s election, there has been an increase in the share of Republicans who think the country will be less divided five years from now. Still, just 36% of Republicans say this; even fewer Democrats (16%) expect the country’s political divisions to narrow in the coming years.
For more than a decade, majorities have routinely described the nation as increasingly divided. But the current share expressing this view is the highest it has been at any point since the question was first asked in 2004.
The current mood stands in stark contrast to January 2009, before Barack Obama took office. At that time, just 46% said the nation was more politically divided. But a few months into Obama’s first term, the share saying the country was more divided politically had risen to 61%.
The nature of the country’s political divisions is a rare point of partisan agreement: Comparable majorities of Democrats and Democratic leaners (88%) and Republicans and Republican leaners (84%) say the country is more divided these days than in the past.
The latest national survey by Pew Research Center, conducted Jan. 4-9 among 1,502 adults, finds little optimism that the country’s political divisions will subside any time soon: 40% expect the country to be about as politically divided in five years as it is today, while 31% think it will be even more divided; just 24% expect divisions to lessen.
In the wake of Trump’s election, there has been an increase in the share of Republicans who think the country will be less divided five years from now. Still, just 36% of Republicans say this; even fewer Democrats (16%) expect the country’s political divisions to narrow in the coming years.