Methodology
The analysis in this report is based on telephone interviews conducted November 30-December 5, 2016 among a national sample of 1,502 adults, 18 years of age or older, living in all 50 U.S. states and the District of Columbia (375 respondents were interviewed on a landline telephone, and 1,127 were interviewed on a cell phone, including 664 who had no landline telephone). The survey was conducted under the direction of Abt SRBI. A combination of landline and cell phone random digit dial samples were used; both samples were provided by Survey Sampling International. Interviews were conducted in English and Spanish. Respondents in the landline sample were selected by randomly asking for the youngest adult male or female who is now at home. Interviews in the cell sample were conducted with the person who answered the phone, if that person was an adult 18 years of age or older. For detailed information about our survey methodology, see https://legacy.pewresearch.org/methodology/u-s-survey-research/
The combined landline and cell phone sample are weighted using an iterative technique that matches gender, age, education, race, Hispanic origin and nativity and region to parameters from the 2014 Census Bureau’s American Community Survey and population density to parameters from the Decennial Census. The sample also is weighted to match current patterns of telephone status (landline only, cell phone only, or both landline and cell phone), based on extrapolations from the 2015 National Health Interview Survey. The weighting procedure also accounts for the fact that respondents with both landline and cell phones have a greater probability of being included in the combined sample and adjusts for household size among respondents with a landline phone. The margins of error reported and statistical tests of significance are adjusted to account for the survey’s design effect, a measure of how much efficiency is lost from the weighting procedures.
The following table shows the unweighted sample sizes and the error attributable to sampling that would be expected at the 95% level of confidence for different groups in the survey:
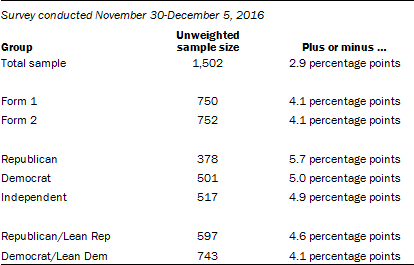
Sample sizes and sampling errors for other subgroups are available upon request.
In addition to sampling error, one should bear in mind that question wording and practical difficulties in conducting surveys can introduce error or bias into the findings of opinion polls.
Pew Research Center undertakes all polling activity, including calls to mobile telephone numbers, in compliance with the Telephone Consumer Protection Act and other applicable laws.
Pew Research Center is a nonprofit, tax-exempt 501(c)(3) organization and a subsidiary of The Pew Charitable Trusts, its primary funder.

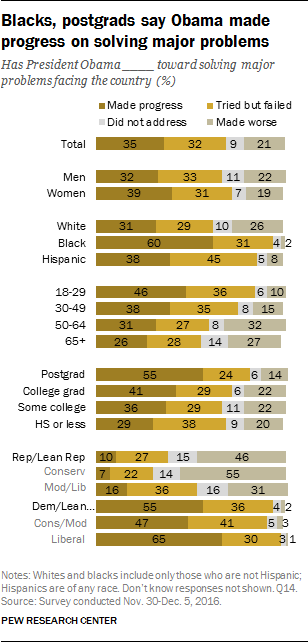
 At the same time, many express skepticism about whether Obama has been able to make progress on the major problems facing the nation, and whether his accomplishments will outweigh his failures. Democrats and Republicans have distinctly different views on Obama’s legacy, and these partisan divides are greater today than they have been for other recent presidents.
And when asked in an open-ended question what Obama will be most remembered for, more cite the Affordable Care Act – which faces an uncertain future in the Republican-controlled Congress – than anything else.
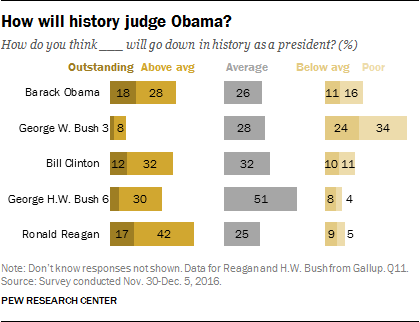
The latest national survey by Pew Research Center, conducted Nov. 30-Dec. 5 among 1,502 adults, finds that 45% expect Obama to be remembered as an above average or outstanding president, while 26% expect he will be viewed as average, and about as many (27%) say he’ll be seen as a below average or poor president.
Obama fares well when compared with past presidents. Expectations for Obama’s historical record are far more positive than those of George W. Bush at the end of his term (when 57% predicted that he would be remembered as a below average or poor president), and are roughly on par with views of Bill Clinton when he left office.
At the same time, many express skepticism about whether Obama has been able to make progress on the major problems facing the nation, and whether his accomplishments will outweigh his failures. Democrats and Republicans have distinctly different views on Obama’s legacy, and these partisan divides are greater today than they have been for other recent presidents.
And when asked in an open-ended question what Obama will be most remembered for, more cite the Affordable Care Act – which faces an uncertain future in the Republican-controlled Congress – than anything else.
The latest national survey by Pew Research Center, conducted Nov. 30-Dec. 5 among 1,502 adults, finds that 45% expect Obama to be remembered as an above average or outstanding president, while 26% expect he will be viewed as average, and about as many (27%) say he’ll be seen as a below average or poor president.
Obama fares well when compared with past presidents. Expectations for Obama’s historical record are far more positive than those of George W. Bush at the end of his term (when 57% predicted that he would be remembered as a below average or poor president), and are roughly on par with views of Bill Clinton when he left office.
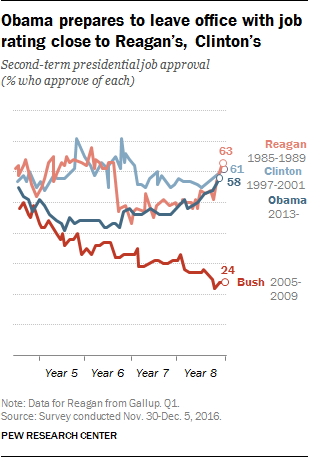 And while more expect Obama to be seen as below average than said this of George H.W. Bush in 1993, more also expect him to be viewed as above average. Among recent presidents, only Ronald Reagan was predicted to fare better in the eyes of history, with a clear majority (59%) saying they thought Reagan would be remembered as above average or outstanding.
Obama is set to leave the White House with a job approval rating only slightly below Reagan’s and Clinton’s. Currently, 58% approve of his job performance, while 37% disapprove. Obama’s job ratings have steadily improved over the last several months, and are the highest they have been since a short-lived bump in approval immediately following his re-election.
However, views of Obama’s job performance – as well as opinions of his historical legacy – are deeply divided along partisan lines.
And while more expect Obama to be seen as below average than said this of George H.W. Bush in 1993, more also expect him to be viewed as above average. Among recent presidents, only Ronald Reagan was predicted to fare better in the eyes of history, with a clear majority (59%) saying they thought Reagan would be remembered as above average or outstanding.
Obama is set to leave the White House with a job approval rating only slightly below Reagan’s and Clinton’s. Currently, 58% approve of his job performance, while 37% disapprove. Obama’s job ratings have steadily improved over the last several months, and are the highest they have been since a short-lived bump in approval immediately following his re-election.
However, views of Obama’s job performance – as well as opinions of his historical legacy – are deeply divided along partisan lines.
 Nearly nine-in-ten Democrats (88%) approve of Obama job’s performance, compared with just 15% of Republicans. That is a wider partisan gap than in George W. Bush’s job approval rating eight years ago (60% of Republicans approved, just 6% of Democrats) or Clinton’s in January 2001 (85% of Democrats approved, as did 35% of Republicans).
Obama’s
Nearly nine-in-ten Democrats (88%) approve of Obama job’s performance, compared with just 15% of Republicans. That is a wider partisan gap than in George W. Bush’s job approval rating eight years ago (60% of Republicans approved, just 6% of Democrats) or Clinton’s in January 2001 (85% of Democrats approved, as did 35% of Republicans).
Obama’s 

 Still, she remains far less positively viewed among Republicans and Republican leaners (44% favorable) than Democrats and Democratic leaners (93% favorable). In particular, conservative Republicans are more likely to have an unfavorable view of the first lady than a favorable one (52% vs. 33%).
While first ladies are generally viewed more positively by those of the same party, Republican views of Michelle Obama are far less favorable than Democratic views of Laura Bush were eight years ago (when 56% of Democrats and Democratic leaners had a favorable view of her).
Still, she remains far less positively viewed among Republicans and Republican leaners (44% favorable) than Democrats and Democratic leaners (93% favorable). In particular, conservative Republicans are more likely to have an unfavorable view of the first lady than a favorable one (52% vs. 33%).
While first ladies are generally viewed more positively by those of the same party, Republican views of Michelle Obama are far less favorable than Democratic views of Laura Bush were eight years ago (when 56% of Democrats and Democratic leaners had a favorable view of her).


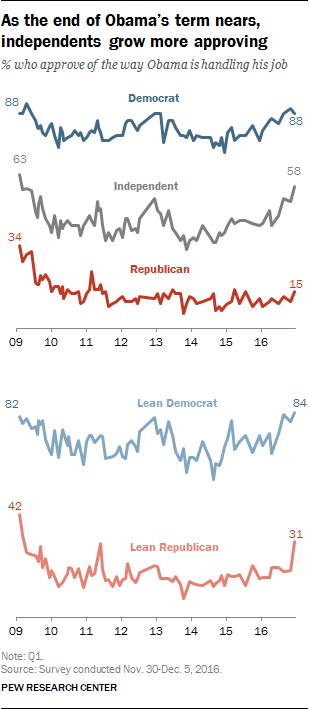 Today, nearly nine-in-ten Democrats (88%) say they approve of the job Obama is doing as president, while just 15% of Republicans say the same. A 58% majority of independents say they approve of the way Obama is handling his job, up six points from October and 16 points from a year ago.
Among Republican-leaning independents, 31% now approve of Obama’s job performance, up from just 19% in late October. And while wide majorities of Democratic leaners have expressed approval of Obama throughout his presidency, that share has grown to 84% today, up from 80% in October and just 67% in April. This is among the highest share of Democratic leaners who have approved of Obama over the course of his presidency.
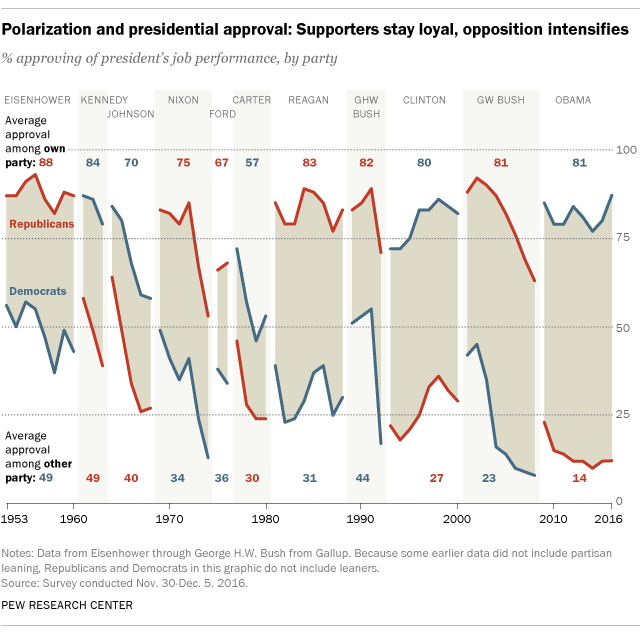
Evaluations of Obama among Republicans and Democrats reflect a growing partisan divide in approval ratings of the president. Now at its widest since the 1950s, the partisan gap in approval is driven by increasingly negative views of the president among the opposition party.
Nearing the end of his two terms, Obama’s average approval stands at 14% among Republicans, compared with 81% among Democrats.
Average ratings of George W. Bush were only slightly less polarized: While 81% of Republicans approved of Bush on average throughout his presidency, just 23% of Democrats expressed a favorable opinion.
By contrast, the partisan divide in approval ratings of prior presidents was less pronounced.
Today, nearly nine-in-ten Democrats (88%) say they approve of the job Obama is doing as president, while just 15% of Republicans say the same. A 58% majority of independents say they approve of the way Obama is handling his job, up six points from October and 16 points from a year ago.
Among Republican-leaning independents, 31% now approve of Obama’s job performance, up from just 19% in late October. And while wide majorities of Democratic leaners have expressed approval of Obama throughout his presidency, that share has grown to 84% today, up from 80% in October and just 67% in April. This is among the highest share of Democratic leaners who have approved of Obama over the course of his presidency.
Evaluations of Obama among Republicans and Democrats reflect a growing partisan divide in approval ratings of the president. Now at its widest since the 1950s, the partisan gap in approval is driven by increasingly negative views of the president among the opposition party.
Nearing the end of his two terms, Obama’s average approval stands at 14% among Republicans, compared with 81% among Democrats.
Average ratings of George W. Bush were only slightly less polarized: While 81% of Republicans approved of Bush on average throughout his presidency, just 23% of Democrats expressed a favorable opinion.
By contrast, the partisan divide in approval ratings of prior presidents was less pronounced.