Survey report
When Pew Research Center first asked Republican voters their preferences for the GOP presidential nomination in March 2015, just 1% volunteered Donald Trump as their first choice.  Thirteen months later, Trump was the first choice of 44% of Republican and Republican-leaning registered voters, more than any of his rivals. Today, 88% of these voters back him in the general election against Hillary Clinton.
At an overall level, Trump’s rise may appear linear; his support increased in the aggregate with each survey over the course of the primary. But in actuality, individual voters’ preferences over this period were quite fluid.

This report and accompanying interactive is based on a longitudinal analysis of the primary and general election preferences of Republican and Republican-leaning registered voters in Pew Research Center’s nationally representative American Trends Panel. This approach provides a window into change and stability in voters’ choices at an individual level over the course of six surveys conducted throughout 2015 and 2016. For more detail, see Methodology used in this report.
From March 2015 to April 2016, nearly all Republican voters changed their minds at least once about who they were supporting for the GOP nomination.
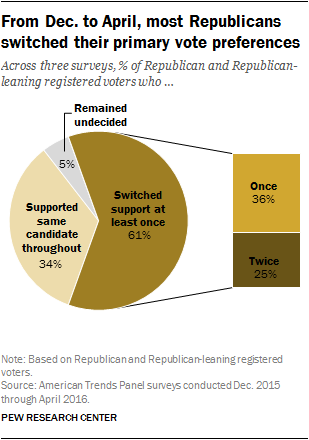
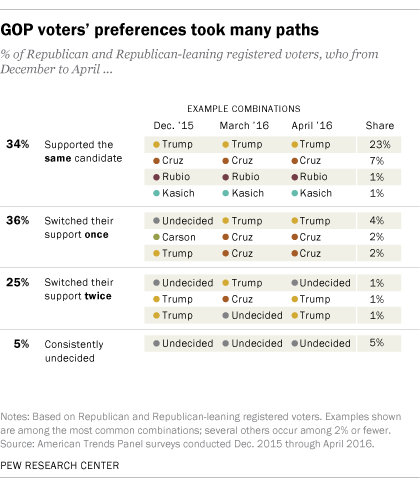
This volatility was not confined to the early stages of the GOP nomination contest. A 61% majority of GOP voters changed their minds at least once across the three surveys conducted from December 2015 to April 2016, as key primary contests were unfolding. A quarter of Republicans changed their minds twice in this period.
Only 34% of Republican voters supported the same candidate at all three points, including 23% who consistently backed Trump over this period – which is by far the largest share “sticking” with a candidate.
The result is a portrait of the fluidity in voters’ decision-making throughout the primary process. Some voters changed their allegiance by necessity, when their preferred candidate dropped out of the race. But others shifted their preferences, from survey to survey, among the active candidates.
In the case of Trump, his overall share of support grew throughout the primary process as he gained support from voters who had backed other candidates or had previously been undecided. But he also lost ground. Trump held on to 70% of his supporters between August and December of 2015, while 30% of those who had supported Trump in August went on to support other candidates or to say were undecided in December. This “churn” in candidate preference was not limited to Trump; all candidates gained, and lost, support during this period.
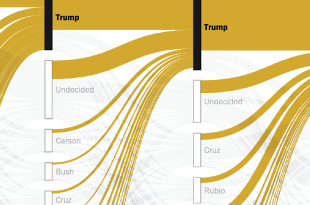
This volatility continued into the primary season. Aside from the 23% of voters who backed Trump consistently across three surveys between December and April, and the 7% of GOP voters who consistently backed Ted Cruz, no single pattern stands out. The accompanying graphic illustrates some of the hundreds of paths that voter preferences took over this period.
Patterns of primary support and the general election
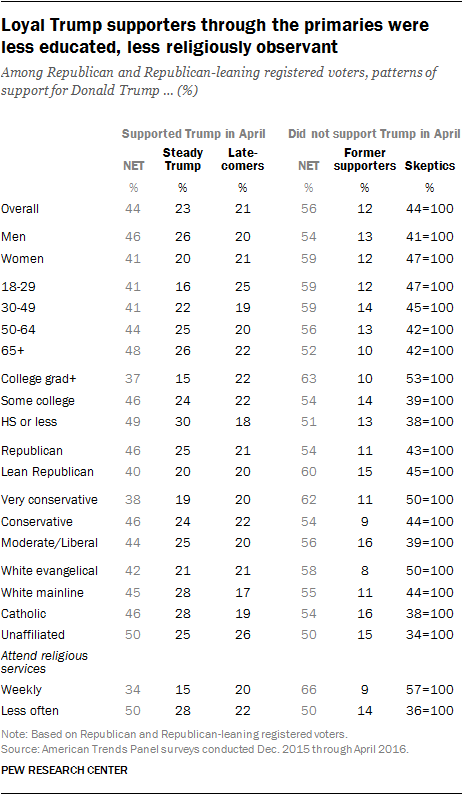
By the April survey (conducted April 5-May 2), when only Trump, Cruz and John Kasich remained in the race for the Republican nomination, Trump was supported by 44% of GOP voters: 23% had consistently supported him since December, while 21% had not.
 Of the remaining 56% of Republican voters, 44% had not named Trump as their first choice in any of the three surveys (December, March or April), including 39% who had named another candidate in at least one survey (just 5% of Republican voters were consistently undecided during this period). An additional 12% of GOP voters had named Trump their preferred nominee in either December or March, but then did not support him in April.
Overwhelming majorities of Republican voters in each of these groups now prefer Trump to Clinton in a general election matchup. However, the intensity of that support varies. Nearly all of those who were loyal supporters of Trump since December (98%) say they will vote for him against Clinton – and 91% are certain they will do so. By contrast, a smaller share of voters who did not support Trump in any of these three surveys back him in the general election: 79% do so, and only 53% of those in this group say they are “certain” they will vote for Trump over Clinton.
Steady Trump supporters, latecomers and skeptics
Throughout the primaries, surveys regularly showed that Trump garnered more support from GOP voters who had not attended college, those who were less religiously observant and men.
 The patterns of support over the course of the primaries show that those in these groups were more likely than others to back Trump early on and stay with him.
While 30% of Republican voters who have not attended college backed Trump across all three surveys between December and April, just 15% of Republican college graduates were early – and consistent– backers of the presumptive GOP nominee.
Republicans who frequently attend religious services were less likely to be steady supporters of Trump in this period. Just 15% of Republican voters who attend services weekly backed Trump consistently, compared with 28% of GOP voters who attended services less often.
Conversely, college educated and more religiously observant Republicans are more likely to have not backed Trump in any of these three surveys. Fully 57% of those who attend services regularly fall into this skeptical group, compared with just 36% of those who attend less regularly. Among Republicans with a college degree, about half (53%) also did not back Trump in any of these three surveys, compared with 39% of those without a college degree.


 Republican Voters Path to Backing Donald Trump