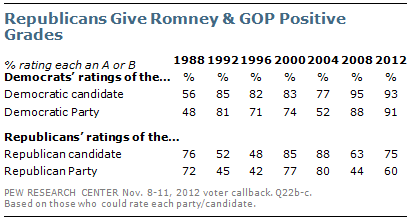
 Voters give mixed reviews of the way the candidates and the parties handled the campaign this year. Of voters who rated Obama, 58% give him a grade of A or B for the way he conducted himself in the campaign.
That is far lower than the 76% who gave Obama equivalent grades four years ago, but on par with the ratings for Al Gore in 2000 and Bill Clinton in 1996. Among Democrats, 93% grade Obama’s campaign an A or B, virtually unchanged from 2008 (95%). Obama’s ratings among Democrats are higher than Clinton’s were for his reelection campaign in 1996 (82% A or B).
 As is generally the case for the losing candidate, Romney receives lower marks than Obama; 45% give Romney an A or B for his campaign. Romney’s ratings are similar to those for John McCain in 2008, but higher than the grades for Bob Dole in 1996 and George H.W. Bush in 1992.
Three-fourths of Republicans (75%) say Romney earned an A or B for the way he conducted himself, which is 12 points more than the percentage of Republicans who gave McCain’s campaign A or B four years ago. Among Republican voters, Romney gets the highest ratings of any losing GOP candidate in the past 25 years.
The Democratic Party gets higher grades than the Republican Party; 54% of voters who rated the party give it an A or B, compared with 39% for the Republican Party. A majority of Republicans (60%) grade the GOP at A or B, which is higher than the 44% that gave top grades to the party after the 2008 election. Democrats give their party about as positive a rating as they did four years ago (91% A or B).
Ratings for other players in the campaign also are fairly low. Only about half (53%) of voters give “the voters” an A or B, far fewer than did so after any election since 1996. The losing party typically gives the voters lower grades than the victors, but Republicans’ grades for the voters are particularly low this year. Just 29% of Republicans give voters an A or B grade, compared with 51% of independents and 79% of Democrats. As a result, this is the largest partisan gap in evaluations of the voters since 1988.
 Nearly half (49%) of voters give pollsters an A or B, down from 58% four years ago. A majority of Democrats (63%) give the pollsters a positive rating. Fewer Republicans (41%) and independents (40%) grade pollsters an A or B for the way they conducted themselves.
Ratings for campaign consultants also are highly partisan. Overall, 44% given them an A or B grade, but Democrats (61%) rate campaign consultants much more positively than Republicans (30%) or independents (39%).
The press receives the lowest ratings of any of the campaign players included in the survey. Just 32% give the press an A or B grade for how they conducted themselves in the campaign. Only 19% of Republicans and 21% of independents give the press a positive rating, compared with 52% of Democrats. (For more on press coverage see Section 4.)
Voters Satisfied With the Candidates
 Seven-in-ten voters say they were very (37%) or somewhat (33%) satisfied with the choice of presidential candidates this year; just 28% say they were not satisfied. Voters are about as satisfied with the choice of candidates as they were after the past three presidential elections and are significantly more satisfied with the choice of candidates than in 1996, 1992 or 1988.
 Obama voters express far more satisfaction with the choice of candidates than Romney voters. Fully 87% say they were satisfied with the candidates, including 56% who were very satisfied. About half (52%) of voters who backed Romney said they were satisfied; only 17% were very satisfied.
Voters who support the winning candidate have typically expressed far more satisfaction with the choice of presidential candidates. Satisfaction among Obama voters is somewhat lower than four years ago but on par with the satisfaction expressed by voters who supported Bush’ reelection in 2004, and higher than among Clinton voters when he was reelected in 1996.
Among Romney voters, satisfaction is somewhat higher than that expressed by voters who backed other losing candidates dating back to 1988, with the exception of those who voted for Gore in the close election in 2000. Satisfaction among Romney voters is 15 points higher than that expressed by McCain voters four years ago.
Most Voters Felt They Made Informed Choice
An overwhelming percentage of voters (87%) say they learned enough about the candidates and the issues to make an informed choice between Obama and Romney. Only 11% said they found it difficult to choose because they did not learn enough from the campaign.
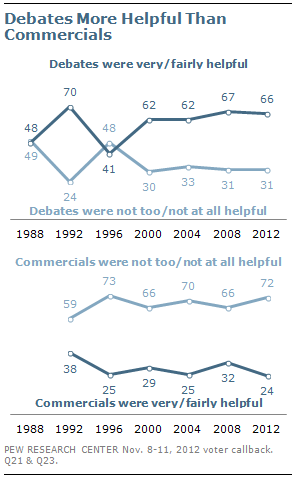
 As has been the case in most previous elections, more voters viewed the presidential debates than campaign commercials as helpful in deciding whom to vote for. Fully 66% say the debates were very or somewhat helpful. That compares with just 24% who view the campaign commercials as helpful; 72% say the campaign commercials were not too or not at all helpful.
There are only modest partisan differences in these evaluations. Fully 91% of Republicans and 92% of Democrats say they learned enough to make an informed choice. Somewhat fewer independents (80%) feel that they learned enough about the candidates.
Similarly, 69% of Republicans and the same percentage of Democrats say the debates were very or somewhat helpful in deciding which candidate to vote for, as do 61% of independents. However, more Democrats (33%) than Republicans (18%) or independents (20%) say campaign commercials were helpful in making their choice.
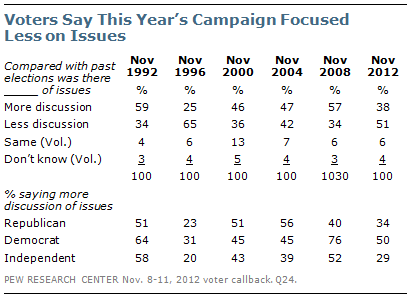
 While voters said they learned enough about the candidates and the issues to make an informed choice, half (51%) say there was less discussion of issues than in past elections; fewer (38%) say there was more discussion of issues.
That is the lowest percentage saying there was more discussion of issues than in any election since 1996. Following that election, just 25% said there was greater discussion of issues than in previous campaigns.
Since 2008, the decline in the percentages saying there was more discussion about issues has been particularly pronounced among Democrats and independents. Half of Democratic voters (50%) say there was more discussion of issues, down from 76% four years ago. And just 29% of independents say there was more discussion of issues, compared with 52% in 2008.
Far More See Negative Campaigning
About two-thirds of voters (68%) say there was more negative campaigning, or mudslinging, than in past elections; just 19% think there was less and 11% volunteer there was the same amount of negative campaigning as in previous presidential campaigns. This is a substantial increase from 2008, when 54% said there was more negative campaigning but is on par with voters’ views of the negativity of the 2004 campaign.
There is a modest partisan difference on evaluations of the negativity campaign; 73% of Republicans said there was more mudslinging in the past, compared with 63% of Democrats. Nearly seven-in-ten (69%) independents also said there was more negative campaigning than in past presidential elections.


