Update: In the years since this piece was published, the survey field has changed. The link between Americans’ willingness to take surveys and their political views became stronger. Researchers developed new methods for addressing this. Pew Research Center’s surveys of U.S. adults now weight on political party affiliation, but the way that is done differs from the approach imagined in this piece.
In every campaign cycle, pollwatchers pay close attention to the details of every election survey. And well they should. But focusing on the partisan balance of surveys is, in almost every circumstance, the wrong place to look.
The latest Pew Research Center survey conducted July 16-26 among 1,956 registered voters nationwide found 51% supporting Barack Obama and 41% Mitt Romney. This is unquestionably a good poll for Obama – one of his widest leads of the year according to our surveys, though largely unchanged from earlier in July and consistent with polling over the course of this year.
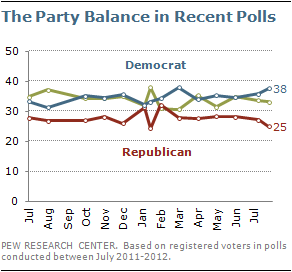 And the survey did interview more Democrats than Republicans; 38% of registered voters said they think of themselves as Democrats, 25% as Republicans, and 33% as independents (to clarify, some reporters and bloggers incorrectly posted their own calculations of party identification based on unweighted figures). That’s slightly more Democrats than average over the past year, and slightly fewer Republicans. Recent Pew Research Center surveys have found anywhere from a one-point to a ten-point Democratic identification advantage, with an average of about seven points.
While it would be easy to standardize the distribution of Democrats, Republicans and independents across all of these surveys, this would unquestionably be the wrong thing to do. While all of our surveys are statistically adjusted to represent the proper proportion of Americans in different regions of the country; younger and older Americans; whites, African Americans and Hispanics; and even the correct share of adults who rely on cell phones as opposed to landline phones, these are all known, and relatively stable, characteristics of the population that can be verified off of U.S. Census Bureau data or other high quality government data sources.
Party identification is another thing entirely. Most fundamentally, it is an attitude, not a demographic. To put it simply, party identification is one of the aspects of public opinion that our surveys are trying to measure, not something that we know ahead of time like the share of adults who are African American, female, or who live in the South. Particularly in an election cycle, the balance of party identification in surveys will ebb and flow with candidate fortunes, as it should, since the candidates themselves are the defining figureheads of those partisan labels. Thus there is no timely, independent measure of the partisan balance that polls could use for a baseline adjustment.
These shifts in party identification are essential to understanding the dynamics of American politics. In the months after the Sept. 11 terrorist attacks, polls registered a substantial increase in the share of Americans calling themselves Republican. We saw similar shifts in the balance of party identification as the War in Iraq went on, and in the build-up to the Republicans’ 2010 midterm election victory. In all of those instances, had we tried to standardize the balance of party identification in our surveys to some prior levels, our surveys would have fundamentally missed what were significant changes in public opinion.
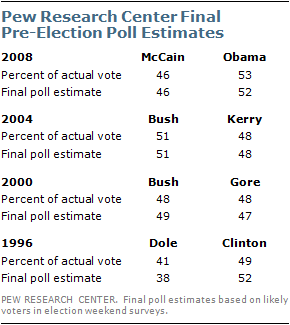 The clearest evidence of this is the accuracy of the Pew Research Center’s final election estimates. In every presidential election since 1996, our final pre-election surveys have aligned with the actual vote outcome, because we measured rising Democratic or Republican fortunes in each year.
In short, because party identification is so tightly intertwined with candidate preferences, any effort to constrain or affix the partisan balance of a survey would certainly smooth out any peaks and valleys in our survey trends, but would also lead us to miss more fundamental changes in the electorate that may be occurring. In effect, standardizing, smoothing, or otherwise tinkering with the balance of party identification in a survey is tantamount to saying we know how well each candidate is doing before the survey is conducted.
What follows is a more detailed overview of the properties of party identification – how it changes over the short- and long-term, and at both the aggregate and individual level. It also includes a detailed discussion of the distinction between registered voters and likely voters, and why trying to estimate likely voters at this point in the election cycle is problematic.
What is Party Affiliation?
Public opinion researchers generally consider party affiliation to be a psychological identification with one of the two major political parties. It is not the same thing as party registration. Not all states allow voters to register by party, and even in states that do, some people may be reluctant to publicly identify their politics by registering with a party, while others may feel they have to register with a party to participate in primaries that exclude unaffiliated voters. Thus, while party affiliation and party registration is likely to be the same for many people, it will not be the same for everyone.
Party affiliation is derived from a question, typically found at the end of a survey questionnaire, in which respondents are asked how they regard themselves in politics at the moment. In Pew Research Center surveys, the question asks: “In politics today, do you consider yourself a Republican, Democrat or Independent?”
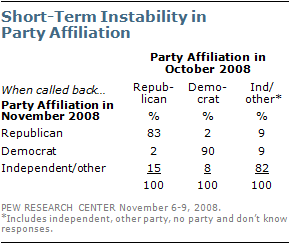 As the wording suggests, this question is intended to capture how people think of themselves currently, and people can change their personal allegiance easily. We continually see evidence of this in surveys that ask the same people about their party affiliation at two different points in time. In a post-election survey we conducted in November 2008, we interviewed voters with whom we had spoken less than one month earlier, in mid-October.
Among Republicans interviewed in October, 17% did not identify as Republicans in November. Among Democrats interviewed in October, 10% no longer identified as Democrats. Of those who declined to identify with a party in October, 18% told us they were either Democrats or Republicans when we interviewed them in November. Overall, 15% of voters gave a different answer in November than they did in October.
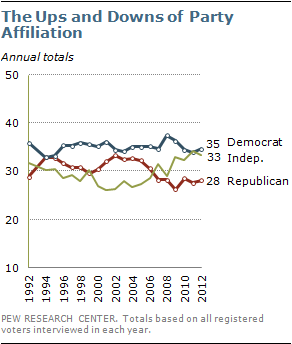 We also see party affiliation changing in understandable ways over time, in response to major events and political circumstances. For example, the percentage of registered voters identifying as Republican dropped from 33% to 28% between 2004 and 2007 during a period in which disapproval of President George W. Bush’s job performance was rising and opinions about the GOP were becoming increasingly negative.
Similarly, the percentage of American voters identifying as Democrats dropped from 38% in 2008 – a high point not seen since the 1980s – to 34% in 2011, after their large losses in the 2010 congressional elections. (For more about the fluidity of party affiliation, see Section 3 of the report, “Independents Oppose Party in Power… Again,” Sept. 23, 2010.)
The changeability of party affiliation is one key reason why Pew Research and most other public pollsters do not attempt to adjust their samples to match some independent estimate of the “true” balance of party affiliation in the country. In addition, unlike national parameters for  characteristics such as gender, age, education and race, which can be derived from large government surveys, there is no independent estimate of party affiliation. Some critics argue that polls should be weighted to the distribution of party affiliation as documented by the exit polls in the most recent election. But the use of exit poll statistics for weighting current surveys has several problems.
First of all, a review of exit polls from the past four elections (including midterm elections) shows the same kind of variability in party affiliation that telephone opinion polls show. Why is an exit poll taken nearly two years earlier a more reliable guide to the current reality of party affiliation than our own survey taken right now?
Second, most pollsters sample the general public – even if they subsequently base their election estimates on registered voters or likely voters in that poll. But the exit polls are sampling voters. We know that the distribution of party affiliation is not the same among voters as it is among the general public or among all those who are registered to vote. How can the exit polls provide an accurate target for weighting a general public sample when they are based on only about half (or less) of the general public?
Registered Voters vs. Likely Voters
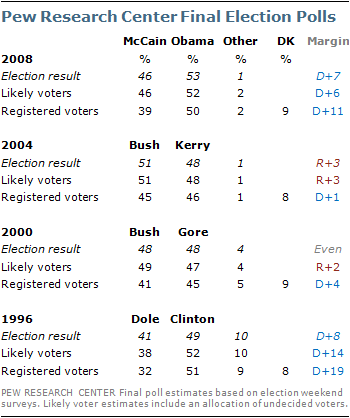 Another common question during election years is why we report on registered voters when we will ultimately base our election forecast on likely voters. We certainly understand that the best estimate of how the election will turn out is one that reflects the voting intentions of people who will actually vote. Most – but not all – people who are registered to vote cast a ballot in presidential election years. It is for this reason that pollsters, including Pew Research, make a substantial effort to identify who is a likely voter (For more details on how likely voters are determined, see “Identifying Likely Voters” in the methodology section of our website).
But, in the same way that party affiliation is not fixed for a given individual, being a “likely voter” is not a demographic characteristic like gender or race. Political campaigns are, in part, designed to mobilize supporters to vote. Although it may feel like the presidential campaign is in full swing, much of the hard work of mobilizing voters has not yet taken place and won’t occur until much closer to the election. Accordingly, any determination of who is a likely voter today – three months before the election – is apt to contain a significant amount of error. For this reason, Pew Research and many other polling organizations typically do not report on likely voters until September, after the nominating conventions have concluded and the campaign is fully underway.
Critics have argued that any poll based on registered voters is likely to be biased toward Democratic candidates, since likely voter screens tend to reduce the proportion of Democratic supporters relative to Republican supporters. This has been the case in Pew Research’s final election polls over the past four presidential elections. In these polls the vote margin has been, on average, five points more favorable to the Republican candidates when based on likely voters rather than registered voters. These final estimates of the outcome have generally been very accurate, especially when undecided respondents are allocated to the candidates.
Yet the effect of limiting the analysis to likely voters can vary over the course of the campaign cycle, even in just the later months. For example, in September and October of 2008, most Pew Research surveys found little difference between election estimates based on all registered voters and those we identified as most likely to vote, suggesting again that determining a likely voter gets more accurate only as Election Day nears.


