The nine typology groups differ not just in the defining components of the typology—their values and attitudes—but also in their demographic makeup. In many cases, groups with similar ideological and political interests are fundamentally different when it comes to demographics, while other groups with differing beliefs share key demographic markers.
Staunch Conservatives stand out as the oldest group in the typology (61% are 50 or older) and also are the most likely to be married. By contrast, Post-Moderns are distinguished by their youth: 67% are younger than 50, including 32% who are younger than 30. (Bystanders, who are defined by characteristics strongly associated with age, also are very young—80% are younger than 50.) And while Libertarians are overwhelmingly male (67%), Hard-Pressed Democrats (61%) and Solid Liberals (57%) are majority female.
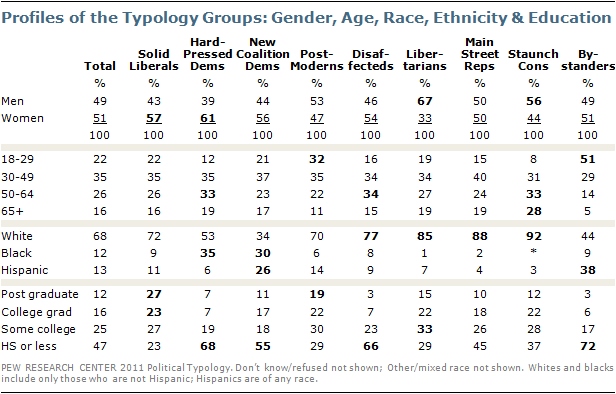 Though there is little racial or ethnic variation among Republican groups (each is three-quarters or more white non-Hispanic), Democratic groups differ considerably in their ethnic composition. Solid Liberals are overwhelmingly white (72%), while Hard-Pressed Democrats are more racially mixed—53% are white and 35% are African American. New Coalition Democrats are majority-minority: 34% white, 30% black and 26% Hispanic. This group also consists of more first- or second-generation Americans than most other groups: 29% of New Coalition Democrats are either themselves immigrants or are the children of immigrants. Overall, 18% of Americans say they are immigrants or children of immigrants.
Educational experiences of groups within the same partisan coalitions also are varied. For instance, half of Solid Liberals (50%), the most educated group, have college degrees. They are joined in the Democratic base by one of the groups with the least amount of educational experience, Hard-Pressed Democrats (68% of whom have a high school degree or less). And the two Republican-oriented independent groups are another study in contrasts when it comes to education—66% of Disaffecteds have no more than a high school education, while 70% of Libertarians have attended at least some college.
Where They Live
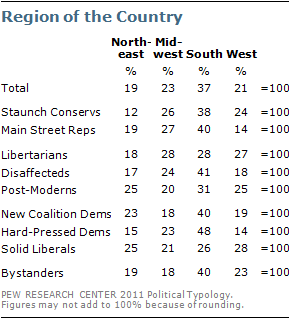 Individuals from all typology groups can be found in regions and communities across the country, but some groups are more concentrated than others. For example, Hard-Pressed Democrats are particularly likely to live in the South (48% live there), while very few Staunch Conservatives can be found in the Northeast (just 12% live there).
Most Solid Liberals (53%) live in either the Northeast or the West, as do half (50%) of Post-Moderns (compared with 40% of the public overall). Fully two-thirds (67%) of Main Street Republicans live in either the Midwest or the South; few live in the West (14%).
Four-in-ten (40%) Solid Liberals live in urban areas, significantly more than any group other than New Coalition Democrats (35% urban) and Bystanders (34%). Hard-Pressed Democrats are the Democratic group most likely to be found in rural areas (where 23% live). And Post-Moderns are the only majority suburban group – 58% live in suburban areas.
Religion and the Typology Groups
Just more than half of Americans say they are Protestants (52%), but substantially more Staunch Conservatives (72%), Main Street Republicans (65%) and Hard-Pressed Democrats (70%) are Protestants. Solid Liberals, Post-Moderns and Libertarians are less likely than the general public to be Protestant.
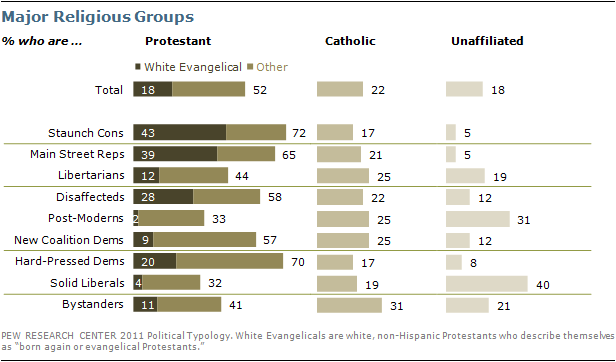 Roughly 18% of Americans are white evangelical Protestants, but this doubles to roughly four-in-ten of the two core Republican groups. The Republican-leaning Disaffecteds also are more likely to be white evangelicals than the general public, but this does not hold true for Libertarians, just 12% of whom are white evangelicals.
 Very few Solid Liberals (4%) or Post-Moderns (2%) are white evangelical Protestants. Instead, these two groups are the most likely to be religiously unaffiliated (atheist, agnostic, or no religious affiliation) – 40% of Solid Liberals and 31% of Post-Moderns, compared with 18% of Americans overall.
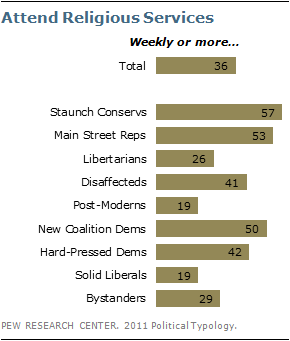
Accordingly, these groups also are the least likely – along with Libertarians – to attend religious services regularly. Just 19% of Solid Liberals and Post-Moderns, and 26% of Libertarians do so. In contrast, Staunch Conservatives (57%), Main Street Republicans (53%) and New Coalition Democrats (50%) stand out for their high levels of religious attendance.
Voting and Political Activity
 Voter registration rates are particularly high among Staunch Conservatives (93% say they are registered to vote) and Main Street Republicans (90%). Two Democratic groups (Hard-Pressed Democrats and Solid Liberals) also have high levels of registration; New Coalition Democrats are less likely than other Democrats to be registered (just 71% are registered). Among the independent groups, Disaffecteds are the least likely to be registered (75%).
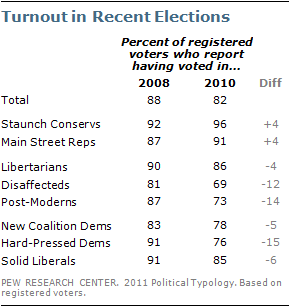 But even among those who are registered, groups differ in their voting rates in recent elections. Nearly all Staunch Conservatives (96%) and 91% of Main Street Republicans who are registered to vote say they voted in the 2010 midterms, on par with reported turnout in the 2008 presidential election. Solid Liberals turned out at similar rates to Staunch Conservatives in 2008, but in 2010 their participation rates lagged behind those of their ideological opposites.
Lower turnout rates in 2010 compared with 2008 were seen among Hard-Pressed Democrats, Disaffecteds, and Post-Moderns.
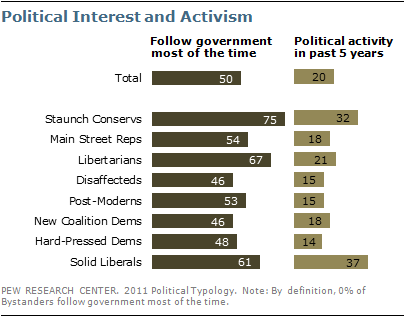 Though different in nearly every aspect of their political beliefs, Solid Liberals and Staunch Conservatives together stand out as the most politically attentive and active typology groups.
Three-quarters of Staunch Conservatives (75%), two-thirds of Libertarians (67%) and about six-in-ten Solid Liberals (61%) say they follow what is going on in government and public affairs most of the time. Nearly four-in-ten (37%) Solid Liberals and 32% of Staunch Conservatives say they have participated in a political campaign, meeting, or rally over the past five years, far more than in other typology groups.
News Habits of the Typology Groups
Pew Research Center news consumption studies have consistently found that television remains the most widely used source of news about national and international events. In the current survey, 43% say they regularly watch network evening news, 30% say they regularly watch Fox News Channel, 24% say they regularly watch CNN and 16% report regularly watching MSNBC. The typology groups have sharply different TV news preferences.
Staunch Conservatives stand out for their use of Fox News for much of their news consumption. Roughly half (54%) say they regularly watch Fox News, and 81% watch at least sometimes. Staunch Conservatives are among the least likely to regularly watch Fox News’ competitors: CNN (8%) and MSNBC (6%).
By comparison, about four-in-ten of those in the other Republican and Republican-leaning groups watch Fox News regularly, though not nearly as exclusively, as a number also watch the other cable channels, as well as network evening news, regularly.
CNN is most popular with Hard-Pressed Democrats (44% watch regularly), many of whom also watch Fox News (35%). New Coalition Democrats and Post-Moderns are more varied in their cable news diets: Those in these groups are about equally likely to watch CNN or Fox News but are somewhat less likely to watch MSNBC. About a quarter of Solid Liberals say they are regular CNN viewers (27%), while 19% say they regularly watch MSNBC and 11% say they watch Fox News regularly.
 While half-or-more Hard-Pressed Democrats (61%), Disaffecteds (52%) and Main Street Republicans (51%) say they regularly watch the nightly network news on CBS, ABC, or NBC, far fewer Solid Liberals (38%), Post-Moderns (38%), Bystanders (35%), Libertarians (35%) or Staunch Conservatives (30%) get regular news from the broadcast networks’ flagship news programs. Almost half of New Coalition Democrats (47%) say they regularly watch evening network news.
That just 30% of Staunch Conservatives regularly watch the “big three” newscasts is particularly noteworthy because of their age profile. The network news audience is relatively older than other news audiences, and Staunch Conservatives are the oldest typology group.
About one-in-six (16%) Americans regularly get their news from NPR. Solid Liberals (34% regularly listen) and New Coalition Democrats (25%) stand out for their reliance on NPR. Notably, 17% of Republican-leaning Libertarians also are regular listeners. By comparison, relatively few Hard-Pressed Democrats (6%) and Staunch Conservatives (8%) listen to NPR regularly.
Local daily newspapers are a regular source of news for about half in most typology groups. New Coalition Democrats diverge significantly from other groups; just 34% regularly read a daily paper. And Solid Liberals read The New York Times at higher rates than other groups; 18% say they are regular readers. By contrast, just 1% of Staunch Conservatives, and 1% of Libertarians, say they read the Times regularly.
Some of the broadest gulfs between typology groups in terms of media consumption can be found for specific programs. Staunch Conservatives are more than twice as likely as any other typology group to say they regularly watch or listen to Glenn Beck (23%) and Rush Limbaugh (21%). At the same time, 21% of Solid Liberals and 14% of Post-Moderns are regular viewers of the Daily Show with Jon Stewart, the highest percentages among any typology groups.
Social Networking
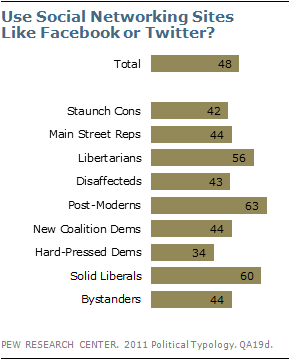 About six-in-ten Post-Moderns (63%) and Solid Liberals (60%) use social networking sites like Facebook or Twitter, as do 56% of Libertarians.
Typology groups with higher proportions of older people, particularly the less affluent Hard-Pressed Democrats, are less likely to use these sites (just 34% of Hard-Pressed Democrats are social networkers).


