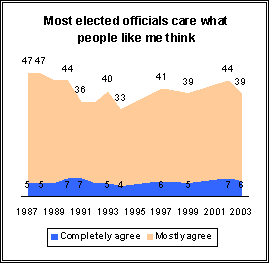
 Americans have long had a cynical view of politics and politicians. But these attitudes are no more widespread today than before the overtime presidential election of 2000. In fact, on several measures, the public is considerably less negative toward politics now than in the mid-1990s, when anti-Washington hostility was rampant. And one important trend continues: following the tumult of the 1994 elections, the public has been much less intrigued by the candidacy of political outsiders.
There is broad agreement that elected officials in Washington quickly lose touch with the people. Three-quarters of Americans agree, but that is fewer than in the early 1990s, when more than 80% consistently said Washington officials lose touch with the people. And while only about four-in-ten (39%) believe that “most elected officials care what people like me think,” that is still a modest improvement from 1994 (33%).
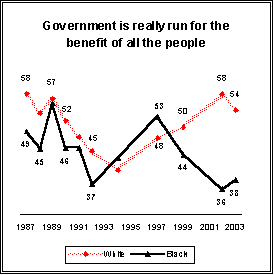
 Despite the low regard Americans have for politicians, most profess faith in the system and, to a lesser degree, in government. Nearly three-quarters of Americans (73%) believe that voting gives people like them some say about how the government runs things notably, that number has remained steady since 1999, a year before the controversial presidential election. Moreover, while most Americans view the government as inefficient and wasteful, 52% believe the government “is really run for the benefit of all the people.”
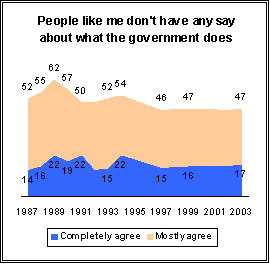
Similarly, the percentage of people agreeing that “it is time for Washington politicians to step aside and make room for new leaders” peaked in 1992 at 84% and has declined since then to 63%. And significantly fewer people feel a sense of estrangement from the government: 47% say people like them “don’t have any say about what the government does,” down from a peak of 62% in 1989.
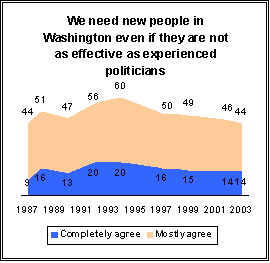
 Consequently, the idea of electing political outsiders has lost much of the appeal it had in the early 1990s. Only about four-in-ten Americans (44%) agree that “We need new people in Washington even if they are not as effective as experienced politicians.” Fully six-in-ten expressed that opinion in 1994.
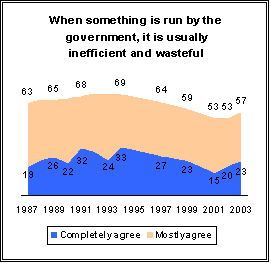
Negative evaluations of government performance also have subsided from their peak levels early in the last decade. In 1994, 69 percent agreed that “when something is run by the government, it is usually inefficient and wasteful ,” with 33% completely agreeing. Today, 57% express this view, and fewer than a quarter (23%) completely agree.
Republicans More Comfortable With Government
 Over the past decade, Republicans and Democrats have significantly changed their views of government and politics in response to Washington’s shifting balance of power. Republicans, who were generally hostile toward government in the mid-1990s, have undergone a dramatic transformation with their party in control of the White House and Congress.
In 1994, fewer than four-in-ten Republicans (37%) felt the government was run for the benefit of all the people. But since the 2000 election, the number of Republicans expressing that opinion has increased to 69%. The Republicans’ more favorable view of government is seen in several other measures as well: Six-in-ten (59%) still regard the government as wasteful and inefficient, but that is far fewer than in 1994 (77%).
By contrast, Democrats have become more skeptical of government. Just 44% now say government is run for the benefit of all the people, down 12 points from President Clinton’s second term (56% in 1997). Democrats are still less likely to regard the government as wasteful and inefficient than are Republicans, but since 1999 the partisan gap has narrowed considerably (59% of Republicans, 53% of Democrats).
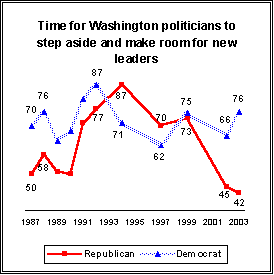 As might be expected, the parties also have traded places on the need for new leadership in Washington. In 1992, the last year of George H. W. Bush’s presidency, Democrats strongly felt that it was time for “Washington politicians to step aside and make room for new leaders,” but by 1997 with President Clinton in the White House this feeling had subsided.
Conversely, Republicans yearned for change in 1994; nearly nine-in-ten (87%) wanted new leaders in Washington. When the election that year put their party in control of Congress, their frustration decreased. Now that Republicans control both the Congress and the White House, less than a majority of Republicans (42%) want to see new leadership; not surprisingly, Democrats disagree.
Political independents have consistently favored new leadership in Washington, regardless of which party is in power. Today, roughly two-thirds of independents (68%) believe it is time for the current crop of Washington politicians to step aside, a modest increase from last year (63%).
The Democrats’ political setbacks are reflected in their general sense of frustration, but Democratic attitudes toward voting seem largely unaffected by the 2000 election. About seven-in-ten Democrats (71%) agree with the statement “Voting gives people like me some say about how government runs things.” That is only a modest decline from 1999 (76%) and consistent with Democratic opinions on this measure for more than a decade.
But Republicans have become much more upbeat about voting. Nearly nine-in-ten (86%) say it gives them some say about the government the highest percentage among Republicans in the values surveys. In 1994, just 68% of Republicans expressed that view.
Blacks More Cynical About Politics, Not About Voting
Blacks and whites are more similar than different when it comes to views of the responsiveness of government and the political system. For example, roughly the same proportion of African Americans (76%) and whites (75%) believe that “elected officials in Washington lose touch with the people pretty quickly.”
 There is little to suggest that the disputed 2000 presidential election had a particular impact on African Americans’ confidence in the electoral process. Fully two-thirds of blacks say “voting gives people like me some say about how government runs things,” no lower than the percent holding this view prior to the 2000 election.
But African Americans have become increasingly cynical on other measures of government responsiveness over the past four years. After the 2000 election, black frustration with the government set in more quickly than it did among white Democrats, and, in some ways, runs deeper. For example, the percentage of black Democrats who say “people like me don’t have any say about what the government does” increased 24 points between 1999 and 2002 (34% to 58%), while white Democrats’ views were more stable. But in the current survey, comparable percentages of black and white Democrats feel they don’t have any say about what the government does (54% black Democrats, 52% white Democrats).
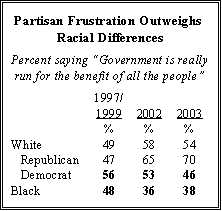 Black and white views on whether the government is really run for the benefit of all people appear to be moving in opposite directions overall, with blacks becoming more cynical and whites less so. However, white Democrats and white Republicans are moving in opposite directions. Though blacks remain somewhat more cynical than white Democrats about whether government really benefits all Americans, both have become increasingly frustrated under the Bush administration.
Young People Cynical About Politics, Not Government
By most measures of opinion on politics and politicians, there are few systematic differences between younger and older Americans. Just a few percentage points separate the youngest and oldest respondents on attitudes such as the belief that elected officials quickly lose touch with the people, or that public officials care with they think.
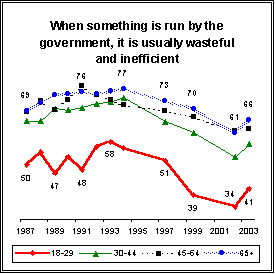 But young people consistently have expressed a more positive opinion of government performance than do older Americans. More than half of those under age 30 (55%) say government is run for the benefit of all the people, compared with 43% of those age 65 and older.
The generation gap is especially stark in attitudes toward whether the government is wasteful and inefficient. Majorities in every age group express that view, with the exception of the youngest Americans; just 41% of those under age 30 say government is wasteful and inefficient.
Political Engagement Stable
Americans today express about the same degree of interest in politics both at the national and local levels as they did in the late 1980s. About nine-in-ten say they are interested in keeping up with national affairs (about half completely agree), and about three-quarters are interested in local politics. Similarly, nine-in-ten agree that “it’s my duty as a citizen to always vote.” But significantly fewer (68%) say they always or nearly always make it to the polls.
While the sense of civic duty remains strong, many admit that they do not live up to the ideal. Roughly half (48%) say they keep up “most of the time,” but about as many (50%) say they follow politics, at most, only “some of the time.” These numbers have not varied much over time.
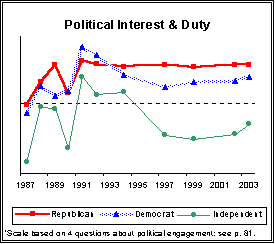 Young people, the less educated and less affluent, and political independents are groups that pay the least attention to and express the lowest levels of concern about politics.
Throughout the past decade and a half, Republicans have usually expressed greater interest in politics than have Democrats, but the bigger gap is between partisans and independents. When multiple measures of political interest and attention are considered, independents lag well behind both Republicans and Democrats in engagement. This has been the case for the more than a decade; not since 1992 have independents displayed a comparable level of political interest as members of the two major parties.

Voter Registration
Overall, 73% of Americans say they are certain that they are currently registered to vote. But the rate of registration ranges from a high of 86% among the oldest cohort of citizens (those age 65 and older), down to 47% of Asian Americans and 51% of people under the age of 30.
Age is the most important predictor of voter registration. Eight-in-ten people age 50 and older say they have registered to vote. Among those who have just come of age politically ages 18-21 only 42% are registered. This rises to 53% among those age 22-25 and to 59% by age 26-29. But it is not until around age 40 that registration rates match the national average. In addition, there is evidence from U.S. government surveys that rates of registration and voting among young people are lower today than they were 20 or 30 years ago, even as rates among older individuals have not declined.
Greater education and income also are associated with higher rates of registration. Among college graduates, 85% report being registered, while only 54% of people who never finished high school are on the rolls. Similarly, more than eight-in-ten of those with family incomes at or above $75,000 (84%) say they are registered; for those with incomes under $20,000, the rate is 60%.
Partisanship and ideology are related to this measure of engagement in the political process. Conservative Republicans lead the pack with an 85% registration rate, followed by conservative to moderate Democrats (81%), liberal Democrats (79%), and moderate to liberal Republicans (77%). Independents trail at 67%.
Voter registration rates vary by religious affiliation as well. Jews top the list with an 84% registration rate. Other groups with high rates are Catholics (81%), evangelical Protestants both white (79%) and black (80%) and white mainline Protestants (77%). Black mainline Protestants (71%) register at just below the national average, and secular individuals have the lowest registration rates among the major religious categories.
Racial and ethnic differences are stark, especially when considering newer immigrant groups. Whites as a group fall above the national average at 75%, while blacks fall right at the average (72%). Hispanics are registered at a 58% rate, and Asian Americans at only 47%.


