Far More Republicans Satisfied Than in ’96
While Americans are more indifferent to the presidential election than at this stage in the campaigns of 1992 or 1996, they also are more satisfied with their choice of candidates. Indeed, more than six-in-ten (62%) express satisfaction with the candidates, far more than at a comparable point in the Clinton-Dole campaign of four years ago (46%), or the 1992 race between Clinton and Bush (37%).
 The biggest jump in satisfaction comes among Republicans, many of whom were turned off by the Clinton-Dole match-up. Nearly three-quarters of Republicans (73%) are content with this year’s candidate slate, a 24% increase from 1996. The change in GOP attitudes is striking; in 1996, nearly as many Republicans were dissatisfied by their choices as satisfied (48%-49%). It also represents a major shift from 1992, when just 47% of Republicans were satisfied with the candidates.
Democrats and independents are also more pleased with their choices this election. Two-thirds of Democrats (66%) express satisfaction with the Gore-Bush contest, up 10 percentage points from four years ago and 30 points from eight years ago. A majority of independents are satisfied with the match-up (52%), compared to 36% who were content at this stage in 1996 and 30% in 1992.
This rise in satisfaction with the candidates has been accompanied by a more modest increase in the number of people who find the current campaign interesting. Still, fewer than three-in-ten (28%) rate the campaign to date as interesting, while 65% label it dull. Among Republicans, there has been a nine-percentage point gain since 1996 in the number who find the campaign interesting (from 22% to 31%) along with a 10-point gain among independents (from 14% to 24%).
There is no consensus among those turned off by the campaign as to why they find it boring: Approximately equal numbers point the finger at the quality of the candidates (17%), their campaign styles (18%), and press coverage of the election (17%).
While satisfaction with the candidates has increased, nearly half of Americans (46%) say it is at least possible that they would cast a vote of no confidence in all of the candidates if they had the chance. The number of people who are open to voting for “none of the above” is down from 1992, when a 54% majority expressed at least some interest in casting votes of no confidence.
Reflecting their lower rates of satisfaction with the candidates, far more independents than Democrats or Republicans prefer the none-of-the-above option. Fully six-in-ten independents say it as at least possible they would cast a vote of no confidence with the candidates, compared to 41% of Democrats and 35% of Republicans.
Bush Gets Better Grades
Rating the candidates on their persuasive abilities, the public gives Bush slightly higher grades than Gore. Equally important, Bush’s campaign is much more highly regarded than Dole’s was at a comparable stage in the campaign four years ago.
Four-in-ten registered voters award Bush letter grades of “A” or “B” for making a convincing case for his election; just over half that number (22%) gave the same grades to Dole in July 1996. Bush has made significant gains among GOP partisans. While 64% of Republican voters give Bush an A or a B, just 41% awarded those grades to Dole.
Bush’s narrow edge over Gore probably reflects his lead in the presidential horse race. While 40% give Bush the highest grades, slightly more than one-third (35%) give Gore an A or B. Bush also gets higher marks from Democrats (24% award him an A or B) than Gore earns among Republicans (15%). And more independents give Bush the top letter grades (35%) than Gore (29%).
Few Seek Campaign News
The public’s declining interest in politics is shown in the shrinking audiences for campaign coverage provided by newspapers, television news and other traditional media. And these smaller audiences, by and large, are not comprised of political junkies. Only a small minority (15%) actually goes through the effort of looking for campaign news; the vast majority (83%) typically comes across such information by happenstance.
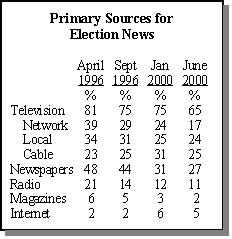
 Most Americans (65%) cite television as their primary source for campaign news, but that figure is down sharply from the last presidential campaign, when about eight-in-ten cited television as their top election news source. The television audience has also slipped since the beginning of this year, when 75% named TV news as the main source of campaign information. Network news, which as recently as 1992 was named as a top source by half of Americans, now is mentioned by fewer than one-in-five (17%).
One-quarter mention cable news as their primary source for election news, about the same as in 1996 and down from 31% in January of this year, a period when both parties were waging primaries battles.
Newspapers are cited as a primary source by one-quarter of Americans, down significantly from four years ago when more than four-in-ten named newspapers as the top source. Newspapers are far more popular as an election news source among college graduates (36%) than either network news (18%) or cable news (22%). Older, affluent Americans are also more reliant on newspapers than other news outlets to keep up with the campaign.
Not even the rise of the Internet as a news source has been able to stem the overall decline in the audience for campaign news. Just 5% of the public — and 8% of those who go online — cite the Internet as their main election news source. While young people are more likely than those in other age groups to cite the Internet, less than one-in-ten of those age 18-29 (9%) name the Internet as their primary source for campaign news.
Active Consumers Prefer Newspapers, Cable
Older Americans are more likely than younger people to actively seek campaign news. Still, only 21% of those age 50 and over — who tend to be heavier consumers of most types of news — say they go looking for election news while 77% say they do not. Less than one-in-ten of those age 18-29 (9%) and 12% of those 30-49 search for campaign news.
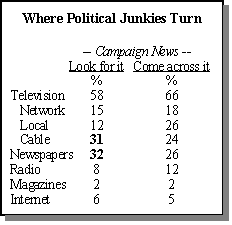
 Those who go looking for campaign news turn to different outlets than the much larger group that does not intentionally seek such information. Fewer active consumers of political news turn to television (58%) than those who do not search for such news (66%). Active consumers are slightly more likely to use newspapers (32%) and cable (31%) to learn about the campaign than passive consumers of political news (26% and 24%, respectively).
Local television news is named as the primary source for political information by fully one-quarter (26%) of the passive political news audience, compared to only 12% of the active consumers of such news. Both groups are about as likely, or unlikely, to turn to the Internet for political news, with 6% of the active group and 5% of passive consumers of political news going online to learn more about the campaign.
Fair Ratings for Press Coverage
A solid majority of Americans (60%) are satisfied with the amount of coverage the media is devoting to the presidential campaign. Fewer (48%) rate that coverage good or excellent. But that 48% represents an increase of six percentage points from July 1996.
For the most part, Americans who say they are less interested in the current election than the 1996 campaign do not blame the media. Indeed, those who are less interested give the media almost the same high marks as the general public, with 46% of this group rating coverage good or excellent. Slightly more than half (51%) of those who are more interested in the current campaign grade coverage as good or excellent.
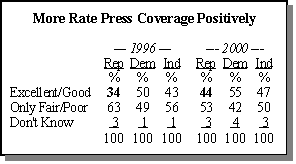
 Republicans, who are far more satisfied with the candidates this time around, are also more content with the way the press is covering the campaign. During the last campaign, just over one-third of Republicans (34%) rated coverage good or excellent; 44% consider coverage of the current campaign good or excellent. Democrats and independents are slightly more satisfied with press coverage this time around.
Most Americans are satisfied with the amount of campaign coverage, regardless of their partisan leanings. Solid majorities of all age groups also say news organizations are providing the right amount of coverage. But young people, who are tuning into campaign 2000 at lower rates than their elders, are somewhat more likely to say that the media is devoting too little coverage to the campaign. A sizable minority of those age 18-29 (24%) say news organizations are giving too little coverage to the campaign; 19% of those age 30-49 and 10% of those age 50 and older agree that the amount of coverage has been inadequate.
Republicans Like Gore Plan
Nearly seven-in-ten Americans (69%) say they plan to watch this year’s presidential debates. That figure is likely to grow as the debates approach. In October 1992, for instance, fully eight-in-ten (83%) said they planned to watch that fall’s debates.
Young people and those who have not registered to vote are less interested in viewing the debates. About six-in-ten of those age 18-29 (61%) say they plan to watch the debates, compared to 69% of those 30-49 and 73% of those 50 and older. More registered voters intend to watch the debates (73%) than those who are not registered (58%).
Americans are favorably disposed to the notion of replacing campaign political advertising with a series of weekly debates by the candidates. A majority (54%) say they would prefer a campaign in which the candidates faced off in weekly debates, while 36% opt for the current system of political ads with only a few debates.
Interestingly, slightly more Republicans than Democrats are enthused about the weekly debate proposal — although the idea has been promoted by Gore, the Democratic standard-bearer. While 58% of Republicans prefer more debates and no paid ads, 53% of Democrats agree. Independents also opt for the weekly debates, by a 55%-38% margin.


