Introduction and Summary
Bill Clinton continues to hold a commanding lead over Bob Dole and Ross Perot, but it is not because voters are delighted with his record, or because the electorate is euphoric about economic conditions, or because people expect better things to come. American voters are modest in their enthusiasm for Bill Clinton, except in comparison to his Republican and Reform party rivals.
Dole, for his part, has made little progress in September. The President is drowning him out in the news media, and voters are coming to judge Dole’s campaign approach as too negative.
A Pew Research Center nationwide survey of 1,517 registered voters on average gave Clinton a grade of C for his performance as president. Further, the electorate which largely expects a Clinton victory in November is not optimistic about progress on major national problems over the next four years.
Americans rate their personal financial condition somewhat better than they did two years ago, and much better than they did four years ago, but a large percentage still say they do not earn enough to lead the kind of life to which they aspire (55%), and rate their economic situation negatively (44%). And most Americans continue to think that the American economy is “off track”… except if Bob Dole says so.
When a random half of the respondents in the Pew survey was asked if they thought the American economy was off track, many more said yes than no, 58% vs. 36%. But when the other half sample was asked if they agreed with “Bob Dole’s charge that the American economy is off track”, only 49% said yes, 43% said no.
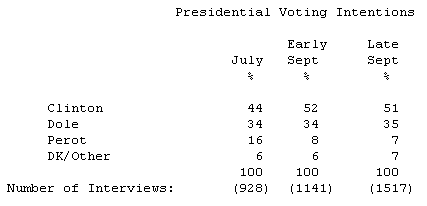
This survey experiment reflects Dole’s inability to capitalize upon lingering economic discontent and other Clinton vulnerabilities. The trend in voting intentions is the bottom line sign of the Dole campaign’s ineffectiveness. Clinton’s lead over Dole and Perot (51% to 35% and 7%, respectively) among all registered voters is similar to our findings in early September. The margin is somewhat smaller among likely voters (50% vs. 38% and 6%, respectively), but there are few signs that Dole has made progress in changing people’s minds.

The proportion of voters who say they have definitely decided not to vote for Dole remains ominously high (44%) and the proportion who say there is a chance they might vote for Dole is almost as modest as it was for Bush four years ago (16% vs. 12%). Dislike of Clinton continues to be the dominant motive for supporting the former Senate Majority Leader.
Voters say they are hearing more about Clinton (47%) than Dole (31%) in the news media these days. Moreover, a 53% majority think the Republican candidate has been too critical of his opponent. Only 21% think Clinton has been too critical of Dole.
Dole’s campaign objectives of rallying Republicans and narrowing the gender gap remain mostly unfulfilled. Fewer than 80% of Republicans and 70% of Independents who lean Republican say they intend to vote for their party’s standard bearer and he continues to trail the President by 22 percentage points among women. Similarly, Dole has been unable to narrow the Clinton margin among many of the dominant population groups that have supported Republican presidential candidates in recent elections — upper middle income voters, whites, and suburbanites.
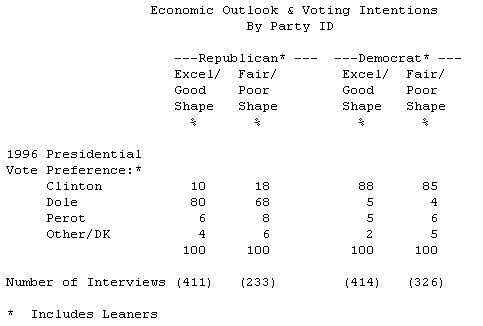
Dole’s failure to have an impact may be related to rising public confidence in the economy, but the survey finds large percentages of voters who remain financially pressured and/or displeased with their wages despite the favorable trend. More than half (55%) rate their own financial situation excellent or good, (up from 49% in 1994 and 42% in 1992). However, 44% say they are in only fair (34%) or poor (10%) shape. Dole runs further behind Clinton among voters unhappy with their finances. Even financially pressured Republicans are less inclined to vote for Bob Dole than are their fellow party members who are better off. In contrast, money woes among Democrats do not discourage voting for Clinton.

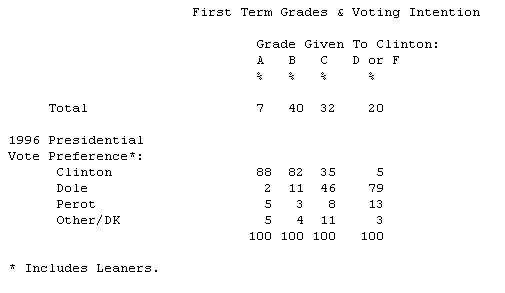
Unable to make economic discontent work for him, Dole also has not been able to fully exploit voter misgivings about Clinton’s performance. Close to half the electorate (47%) grades the President A or B, but just as many rate his four years in office less positively: 32% grade him C and 20% give him a D or F. Those who give Clinton A’s or B’s largely say they will vote for him, while most who give him a D or F are inclined to vote for Dole. However, among those who give Clinton a C grade, Dole leads the president by only a relatively narrow 46% to 35% margin.

Looking forward, voter expectations about the future are correspondingly modest. Most do not see the country making a great deal of progress in dealing with its big problems over the next four years. Fewer than one in three see progress on reducing the budget deficit, curtailing drug abuse and improving jobs. Somewhat greater percentages expect progress on health care reform and improving education. Those who expect Clinton to win re-election (79% of all voters) are less optimistic in many areas than those who think Dole will prevail in November.
This is not to say that voters see no difference between the positions of the candidates. Majorities think Clinton and Dole differ on the economy, tax policy, moral questions, and the role of government. Fewer see major differences on foreign policy, and the tobacco issue. Interestingly, Clinton supporters see fewer policy differences between the candidates than do Dole’s backers, except on the economy and tobacco.
Congress Close
While the presidential race seems wide open, Congressional voting intentions continue to divide closely. Among all registered voters, 49% are inclined to vote for a Democrat in their district and 43% for a Republican (with 8% undecided or saying they will vote for a candidate of another party) . A Pew survey earlier in the month found a similar 51% to 43% margin on these races. Also, as in the earlier survey, when results are based upon likely voters the race tightens to a virtual draw: 48% for the Democratic candidate, 46% for the Republican. [NOTE: The likely voter base assumes a turnout level comparable to the level of participation in 1988.]
Several factors should be considered, in addition to turnout, in weighing the significance of the Democratic lead. Anti- incumbency sentiment is less prevalent now than two years ago (17% vs. 29%) and voters say they will be thinking about local issues to a greater extent than they did in 1994 (38% vs. 27%). Both factors may help the GOP. Cutting in the opposite direction, more people say there is an excellent or good chance they will vote a straight Democratic ticket (36%) than say they will vote a straight Republican ticket (25%).
These cross currents, along with the Center’s finding that generic measures are less accurate in presidential years, suggest that the outcome of the struggle for control of the House may be unforeseeable until election day. More evident are the clear demographic splits in Congressional voting intentions. The GOP leads among men, affluent voters, whites, especially white evangelical Protestants, and white Southerners. There is more support for Democratic candidates among women, voters 50 years of age and older, Easterners and Midwesterners, city dwellers, white Catholics and poorer people. The swing categories, where voting intentions are even, consist mainly of voters under 50, suburbanites, and middle income voters. 1
Minds Made Up?
As the campaign moved into its final month, fewer Americans intend to watch the televised debates between presidential candidates this year than in recent elections and few think the debates will be crucial to their decision on election day.
Only 30% of the public said the debates will matter to them, while fully 65% — two out of three respondents — said their minds were already made up. Men more often than women have their minds made up, as do older Americans, those with the least education, Democrats, likely voters, Dole supporters, and Clinton supporters. The debate matters most to young men (under 30), middle aged women (30 to 49), Independents, 1992 Perot voters, swing voters, and ticket splitters who say they will vote both for Clinton and a Republican Congressional candidate.
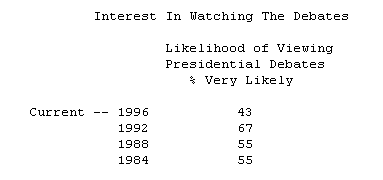
Unlike previous elections, only a minority of registered voters (43%) say they are “very likely” to watch the debates; this compares to 67% in 1992 and 55% in both 1988 and 1984. Among those highly likely to watch are the most and least educated and regular listeners to talk radio.

Of the 77% who said they are very or somewhat likely to watch the debates, almost twice as many said their minds were already made up (48%) as said the debates matter (27%). In this respect the figures parallel 1984 when a majority said they had already made up their minds (54%), twice as many as those who said the debate would matter (26%). [Comparable survey data for 1992 and 1988 is not available.] [NOTE: CBS/New York Times poll.]


