Probability-based panel: This refers to a national survey panel recruited using random sampling from a database that includes most people in the population. Today, most such panels in the United States recruit by drawing random samples of residential addresses or telephone numbers. Typically, data collection with these panels is done online. However, some of these panels interview a small fraction of respondents (usually about 5% or fewer) using an offline mode such as live telephone. These panels are “probability-based” because the chance that each address or phone number is selected is known. However, the chance that each selected person will join the panel or take surveys after joining is not known.
Online opt-in sample: These samples are recruited using a variety of methods that are sometimes referred to as “convenience sampling.” Respondents are not selected randomly from the population but are recruited from a variety of online sources such as ads on social media or search engines, websites offering rewards in exchange for survey participation, or self-enrollment in an opt-in panel. Some opt-in samples are sourced from a panel (or multiple panels), while others rely on intercept techniques where respondents are invited to take a one-off survey.
Benchmark: These are “ground-truth” measures used to assess the accuracy of survey estimates. For example, survey-based estimates for the share of voters who voted for each candidate in the 2020 presidential election are compared to a benchmark based on an official tally by the Federal Election Commission (FEC). Survey estimates are deemed more accurate the closer they are to the benchmark value. In this study, the benchmarks come from high-quality federal surveys such as the American Community Survey or administrative records like the FEC vote tally. Although these benchmarks come from “gold-standard” data sources, they are not entirely free from error. As such, they are not “true” population values but rather the best available approximations.
Error: This is the difference between an individual survey estimate and its corresponding benchmark value. Error can be either positive or negative depending on whether the survey estimate is higher or lower than the benchmark. For example, the FEC benchmark for the share of voters who voted for Donald Trump in the 2020 presidential election is 47%. If a survey estimated that share to be 42%, the error would be -5 percentage points because it came in 5 points below the benchmark. If the estimate were 49%, the error would be +2 points.
Absolute error: This is the absolute value of the error for a survey estimate. It describes the size of the error irrespective of its direction (positive or negative). For example, two estimates that have error of +5 and -5 percentage points, respectively, both have an absolute error of 5 points.
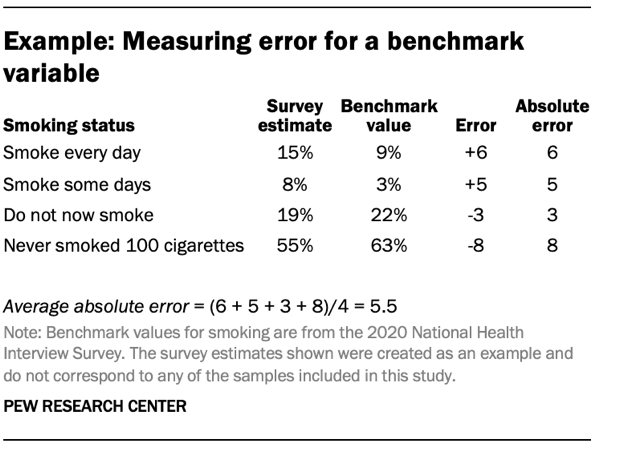
Average absolute error (for a benchmark variable): This is a measure that summarizes the average size of errors across all the categories within a single benchmark variable. For example, the smoking status variable has four categories: 1) Smoke every day, 2) Smoke some days, 3) Do not now smoke and 4) Never smoked 100 cigarettes. A survey’s estimates for each category will have different levels of error, both positive and negative. For a given survey, the absolute error for the smoking status variable is equal to the sum of the absolute errors for each category divided by the number of categories.
Average absolute error (for a sample): Average absolute error can also be used to summarize the overall level of error across many different benchmarks within a single sample. When used in this context, the average absolute error for a sample is equal to the sum of the average absolute errors for each benchmark variable divided by the total number of benchmark variables.
The accuracy of general population estimates is only one facet of data quality for online samples. Frequently, survey researchers also want to understand the similarities and differences between subgroups within the population. For probability-based panels recruited using ABS, obtaining a sufficiently large sample of respondents belonging to small subgroups can be particularly costly, and one selling point for the use of online opt-in samples is their ability to obtain a large number of interviews with members of hard-to-reach groups at comparatively low cost.
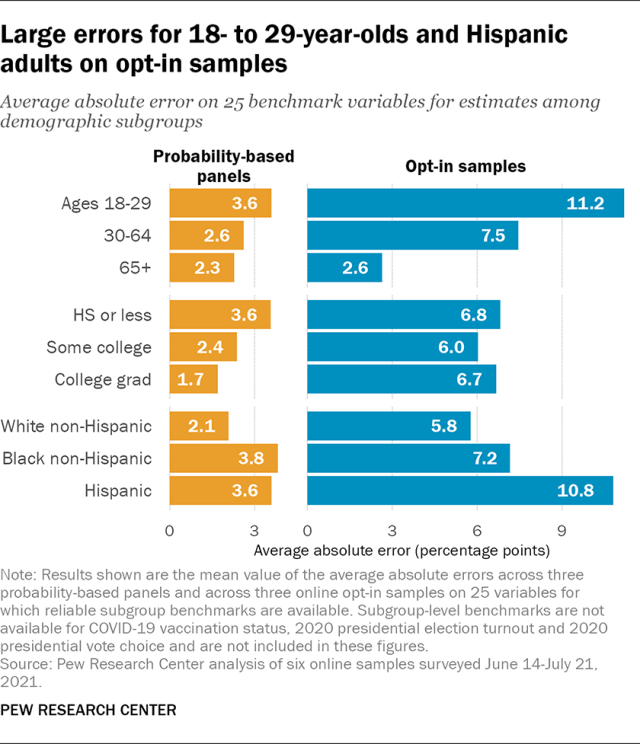
To evaluate the relative accuracy of benchmark subgroup estimates, average absolute error was calculated for each of the samples among subgroups defined by age, education, and race and ethnicity across 25 variables for which subgroup benchmarks were available. 1
The groups with the largest error across the probability-based panels were adults ages 18 to 29, adults with no more than a high school education, Hispanic adults and non-Hispanic Black adults, which averaged between 3.6 and 3.8 percentage points of error across the three panels. This is about 1 to 2 points less accurate than the other subgroups, which all had average errors between 1.7 and 2.6 points.
By comparison, the opt-in samples had larger error on average for every subgroup, and the differences between the most accurate and least accurate subgroups were much larger. This pattern was most striking for age groups. Here, estimates for adults ages 65 and older on the opt-in samples had an average error of 2.6 points, making them nearly as accurate as the probability-based panels. Their average error was higher for ages 30 to 64, at 7.5 points. Average error was highest for those ages 18 to 29, at 11.2 points – about four times as large as the error for ages 65 and older.
Error for racial and ethnic groups in the opt-in samples showed a similar pattern. Estimates among non-Hispanic White adults were the most accurate, with an overall average absolute error of 5.8 points across the three opt-in samples. Average error among non-Hispanic Black adults was somewhat larger, at 7.2 points, while the average error among Hispanic adults was almost twice as large, at 10.8 points.
Large errors on the opt-in samples were also observed regardless of panelists’ level of education. Average errors ranged from 6.0 points for people with some college education to 6.8 points for those with a high school diploma or less.
Opt-in samples had large errors on receipt of government benefits and other variables among 18- to 29-year-olds and Hispanic adults
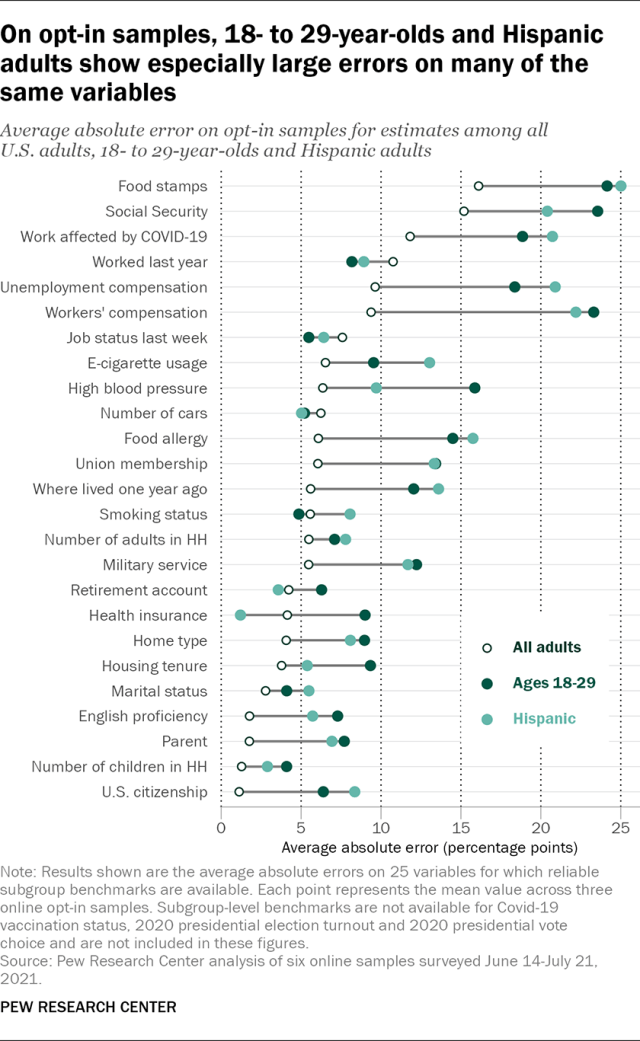
What factors explain the particularly large errors for 18- to 29-year-olds and Hispanic adults on the opt-in samples? While estimates for both groups are characterized by larger errors on a greater number of variables than other subgroups, there are a few that stand out. The four benchmarks related to the receipt of government benefits, which had some of the very largest errors for full-sample estimates, had dramatically larger errors for these groups. The opt-in samples overestimated the share of all adults who received food stamps in the past year by an average of +16 percentage points. This overestimation was higher on average among 18- to 29-year-olds (+24) and Hispanic adults (+25). Receipt of Social Security benefits, which had an average error of +15 points for all adults, had errors of +24 for 18- to 29-year-olds and +20 for Hispanic adults. On average, receipt of unemployment compensation was overestimated by +10 points for all adults, +18 points for 18- to 29-year-olds and +21 points for Hispanic adults. Finally, receipt of workers’ compensation had an average error of +9 points for all adults, compared with a much higher +23 points for 18- to 29-year-olds and +22 points for Hispanic adults.
For another seven variables, the average absolute error for both 18- to 29-year-olds and Hispanic adults was between 5 and 10 points higher than the error for all adults. These variables included whether one’s work was affected by the COVID-19 pandemic, having a food allergy, union membership, military service, 1-year migration status, parental status and U.S. citizenship.
Similar differences in the magnitude of error were also seen for 18- to 29-year-olds on the benchmarks for high blood pressure, housing tenure and English language proficiency, and for Hispanic adults on e-cigarette usage.
The concentration of disproportionately large errors on so many variables within two specific subgroups raises the question of whether these are primarily errors of representation or measurement. For example, are 18- to 29-year-olds who received food stamps simply overrepresented because some aspect of the data collection process makes them much more likely to participate in online opt-in surveys than other 18- to 29-year-olds? Or are these respondents reporting that they received food stamps when in truth they did not? While this study cannot definitively rule out the possibility these individuals are answering honestly, many respondents to the opt-in surveys answered combinations of questions in ways that are more plausibly explained by individual misreporting than the overrepresentation of certain groups.
The population benchmarks for receipt of government benefits in the previous year (food stamps, Social Security, unemployment compensation and workers’ compensation) provide one such example. All of these benchmarks come from the 2021 Current Population Survey Annual Social and Economic Supplement (CPS ASEC), which makes it possible to compute benchmarks for not only the share who received each individual benefit but also for the number of different benefits received. Almost two-thirds of all U.S. adults (62%) did not receive any of these benefits, while 38% received either one or two, according to CPS ASEC data. Adults who received three or four of these benefits comprise only 0.1% of the full U.S. adult population and no more than 0.2% of any demographic subgroup included in this analysis.
By comparison, the estimated share of adults who received three or four benefits ranged from 6% to 9% on the three opt-in samples. Among 18- to 29-year-olds, estimated shares varied between 15% and 18%; for Hispanic adults, those shares were and between 16% and 19%. On all three probability-based panels, the corresponding estimates were 1% for all adults, between 1% and 2% for 18- to 29-year-olds and between 1% and 3% for Hispanic adults.
It is difficult to see how a group that makes up just a fraction of a percent of the population could come to comprise almost one-in-ten of all respondents, and nearly one-in-five of both 18- to 29-year-old and Hispanic respondents on online opt-in samples. A more straightforward explanation would be a group of respondents who are disproportionately choosing the “Yes” answer rather than answering truthfully. The large errors in estimates among 18- to 29-year-old and Hispanic adults are also consistent with a 2020 Center study that found so-called “bogus respondents” – respondents who make little or no effort to answer survey questions truthfully – disproportionately claimed to be either Hispanic or 18 to 29 years old.
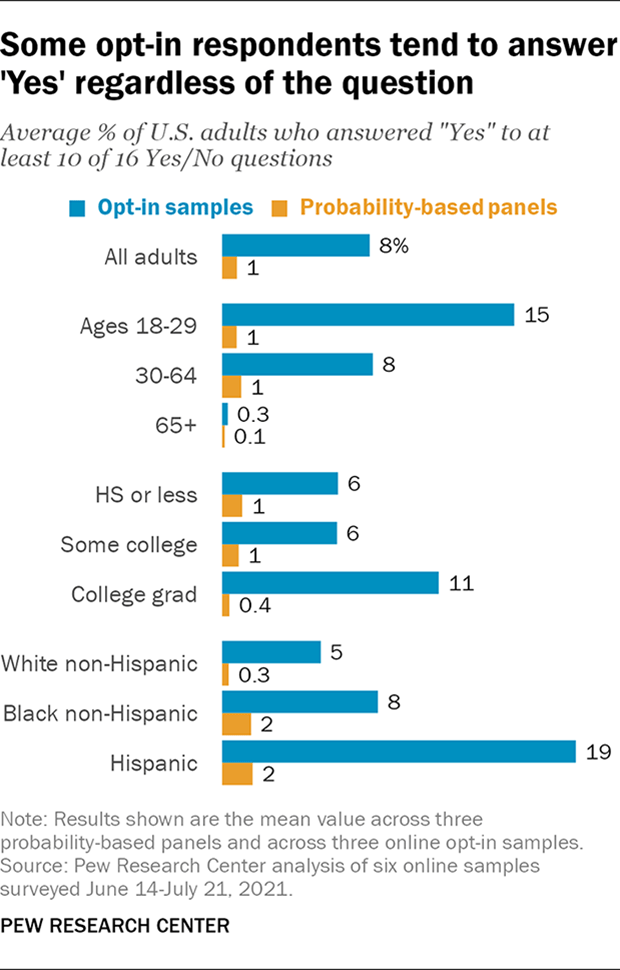
Looking at Yes/No questions more broadly, there remains a consistent pattern. Not counting the question asking respondents if they identify as Hispanic or Latino, there were 12 additional Yes/No questions on the survey that were asked of all respondents, bringing the total number of Yes/No questions to 16. On the probability-based panels, an average of 1% of all adults, 1% of 18- to 29-year-olds and 2% of Hispanic adults answered “Yes” to 10 or more of these questions. On the opt-in samples, the corresponding averages were 8% of all adults, 15% of 18- to 29-year-olds and 19% of Hispanic adults. These results are consistent with the presence of a sizeable group of respondents to the opt-in samples being systematically more likely to answer in the affirmative to Yes/No questions in general.
It is notable that among adults ages 65 and older on the opt-in samples, those saying “Yes” to 10 or more questions comprised only a fraction of a percent on average. This suggests that an absence of bogus respondents within this age group may be a primary reason its accuracy in the opt-in samples was comparable to that of the probability-based panels. One possible reason for this absence may be that on survey measured age by asking respondents to select their year of birth from a drop-down menu with more recent years at the top. Selecting a year of birth corresponding to ages 65 and older would have required more effort than one corresponding to ages 18 to 29, which were much higher up on the list. It is unclear whether a different answer format would have yielded different results.
These findings should not be taken to mean that people who are truly 18 to 29 years old or Hispanic are more likely to misrepresent themselves in online opt-in surveys. It is more likely that individuals who misreport on questions of substantive interest also do so for demographics such as race and age as well. Individuals who are simply attempting to earn survey incentives may be strategically selecting the answer choices they believe are most likely to meet any eligibility criteria for survey participation and least likely to result in being screened out. It is possible that many of the Yes/No questions on the survey resemble the kinds of questions that are commonly used to screen for identify specific subgroups of interest. For example, a bogus respondent seeing a question asking if they have ever vaped may suspect that researchers are conducting a survey of e-cigarette users and that answering “No” would lead to their being screened out. This would be consistent with one recent study that found evidence of widespread falsification intended to get around screening questions in an online opt-in sample. These conclusions are necessarily speculative, as this study was not designed to measure the response strategies of bogus respondents, and this remains an important subject for future research.
However, the fact that such a large portion of the error on the opt-in samples appears attributable to bogus responding that is disproportionately concentrated within specific demographic groups has important implications for practice. The weighting and modeling methods that are most commonly used to adjust for differences between opt-in samples and the larger population are premised on an assumption that the adjustment variables accurately describe the respondents (e.g. that respondents who say they are Hispanic are, in fact, Hispanic) and that what error exists is small and not strongly correlated with substantive variables of interest.
Here, we have seen that error in adjustment variables like age and Hispanic ethnicity appears to be both widespread in opt-in samples and strongly associated with responses to at least Yes/No questions but potentially other kinds of questions where the behavior is not as straightforwardly detectable. While this study did not include trap questions or attention checks, past studies have found such questions to be unsuccessful in identifying bogus respondents. Under such circumstances, there is little reason to expect these kinds of adjustment methods to be successful in the absence of better methods for detecting bogus respondents.
That these kinds of response behaviors appear to be much less common in probability-based panels is heartening and supports a different set of methodological research priorities, particularly correcting the overrepresentation of the most politically and civically engaged respondents.
