By Kyley McGeeney
Introduction
Respondents who take a Pew Research Center survey on a cellphone are currently offered a $5 reimbursement for their cellphone minutes for completing the survey. This policy is a legacy of the days when cellphone plans included a limited number of monthly voice minutes and charged per minute beyond that. But is it still necessary in the age of unlimited talk and text, even for some prepaid cellphone plans? From the survey sponsor’s perspective, the cost of the reimbursement is not limited to the amount actually paid to the respondents, as it also includes the time it takes the interviewer to collect the respondent’s name and address, as well as the processing fees from the survey contractor.
The Pew Research Center experimented with not offering the cellphone reimbursement to a random portion of respondents in its February, March and May 2015 political polls. While the response rate was actually narrowly higher for the group not offered the money, the partisan composition of the sample was affected, with the share of Democrats and Democratic-leaning independents ticking upward. Because of the impact on the partisan makeup of the resulting data, we decided to continue offering reimbursements.
Background
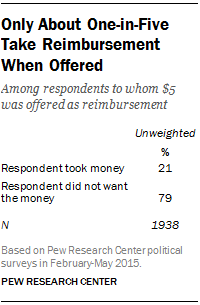
 Currently, in the standard Pew Research Center survey introduction, all cellphone respondents are told: “If you would like to be reimbursed for your cellphone minutes, we will pay all eligible respondents $5 for participating in this survey.” At the end of the survey, they are told: “If you would like to be reimbursed for your cellphone minutes, we can send you $5” (see Appendix A for full wording). In a typical monthly political survey, roughly one-in-five cellphone respondents take the reimbursement when offered. The introductory language is similar to a typical contingent incentive in soliciting participation, though the description of the $5 as a “reimbursement” rather than a “gift” or “token of appreciation” is different from the language used in many survey incentives. And the language at the end of the survey is also phrased less like an incentive, as it tells respondents they may have the money if they want it, rather than attempting to provide it to all cellphone respondents. This, in conjunction with some respondents’ reluctance to provide a name and contact information, may be the reason that only 21% of cell respondents actually give the necessary information to receive the money.
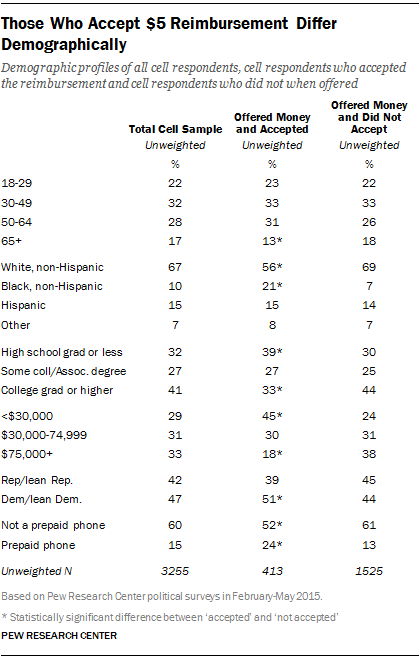
 Cellphone respondents who accept the reimbursement differ demographically from those who do not. Using data from Pew Research Center’s February, March and May 2015 monthly political polls, the analysis suggests those who take the money are more likely to be non-Hispanic black, less educated, of lower income, a Democrat or lean Democratic and to have a cellphone number flagged as prepaid by Targus; they are less likely to be senior citizens. However, since those who take the money are, on average, only 21% of the cellphone sample, the resulting total sample looks much more like those who do not take the money than those who do. The full demographic composition of the two groups can be found in Appendix B.
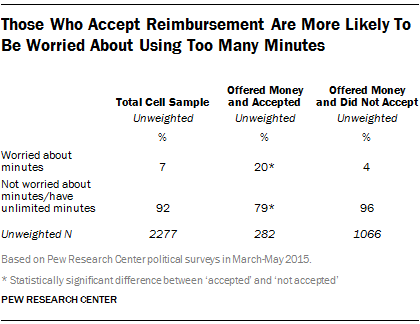
 Not surprisingly, those who are offered and accept the money are also more likely to report being worried about using too many cellphone minutes this month than those who don’t accept the money. This question was asked in March and May only.
The analysis suggests, then, that certain demographic groups are more likely to accept the offer of financial reimbursement than others. It does not automatically follow, however, that without that reimbursement, they would turn into non-responders. This is obviously a key question for survey researchers, because maintaining a demographic balance in the sample, and maintaining or increasing response rates among hard-to-reach groups, is of paramount concern. This is what was tested in the experiment below.
Methods for the Experiment
An experiment was conducted on three Pew Research Center political surveys in 2015 (February, March and May) to determine whether not offering the $5 cellphone reimbursement would affect the response rate and demographic composition of the resulting sample. A random 60% of the cell sample was offered the reimbursement (described as “the reimbursement group” below); the remaining 40% (described as the “no reimbursement group”) were not. Below are response rates, demographics and select substantive responses of the two groups. A Targus flag provided by SSI was appended to all completed cellphone interviews to indicate whether the phone was a prepaid cellphone or not. Additionally, in March and May, cellphone respondents were asked at the end of the interview whether they worried about using too many cellphone minutes that month. Full survey methodology can be found in the About the Surveys section in Appendix D.
Findings
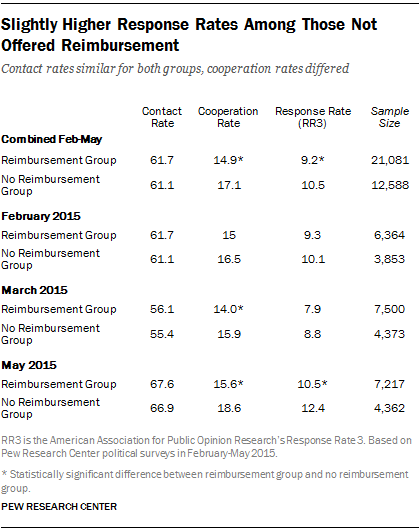
 The response rate was higher for the no reimbursement group than for the reimbursement group (10.5% and 9.2%, respectively). This was driven by the 17.1% cooperation rate among the no reimbursement group and the 14.9% cooperation rate among the reimbursement group. This result was unexpected, since contingent incentives have been shown to increase response rates. Perhaps framing the offer as a “reimbursement for your cellphone minutes” deters respondents because they think the survey must be very long in order to warrant reimbursement.
While 21% of cellphone respondents accepted the money when offered, very few respondents asked for money when it was not offered. Only 2% of respondents did so across the three surveys.
Demographically, respondents in the reimbursement and no reimbursement groups were very similar. They did not differ on age, race/ethnicity, education, income or whether or not the cellphone used was a prepaid phone. This supports the hypothesis that many of those who accept the money when it’s offered would still respond even when the money is not offered. In other words, while non-Hispanic blacks and lower income and less educated individuals were more likely to accept the money when offered, the resulting sample of respondents in the reimbursement group did not differ from the no reimbursement group. The full demographic composition of the two groups can be found in Appendix C.
The exception to this finding is that Republicans and Republican-leaning independents made up a slightly higher share of the reimbursement group than the no reimbursement group. There are about equal numbers of Democrats (46%) and Republicans (44%) in the reimbursement group, while Democrats outnumber Republicans 49%-40% in the no reimbursement group. Relatedly, those in the no reimbursement group are less likely to identify as conservative and to disapprove of President Obama’s job performance.
 It’s not clear what accounts for this paradoxical result. Democrats are more likely than Republicans to accept a reimbursement when it is offered, but constitute a larger share of the sample when a reimbursement has not been offered.
It is tempting to drop the $5 reimbursement, given that this experiment suggests that doing so would result in a small increase in the response rate of the cellphone sample, while at the same time bringing down its cost. However, the experiment also suggests that removing the reimbursement option might reduce the share of Republicans and conservatives in the sample, and without more extensive testing, we don’t know whether that would make the poll more or less accurate. Accordingly, the center has decided not to drop the reimbursement at this time, but will conduct further testing to better understand how the framing of the offer affects a respondent’s decision to participate.


