h3>Recruitmenth3>Recruitment
A 54% majority of those who were invited to join the panel agreed to do so, but not all of these individuals actually took part in panel surveys. Of those invited, 43% joined and responded to at least one wave in 2014, 33% responded to at least five waves and 20% responded to all waves.
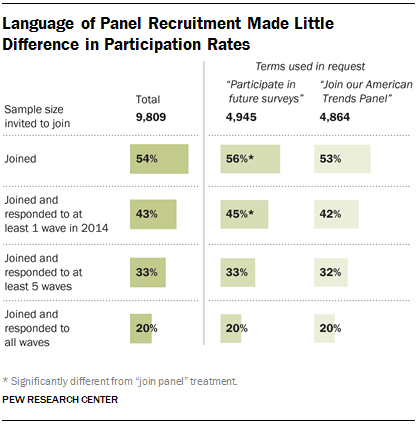
As noted earlier, an experiment was conducted regarding how to ask respondents to join the panel. Half were invited to “participate in future surveys,” while the other half were invited to “join our American Trends Panel” to test whether a vague or specific request would perform better. Beyond how this invitation was phrased, all other characteristics of the panel and responsibilities of panelists were explained in exactly the same way.
A somewhat higher portion of the “future surveys” group (45%) than the “join the panel” group (42%) agreed to join the panel and responded to at least one survey. However, there was no difference between the two groups in joining and responding to five or more waves, or responding to all waves.
Panel Composition
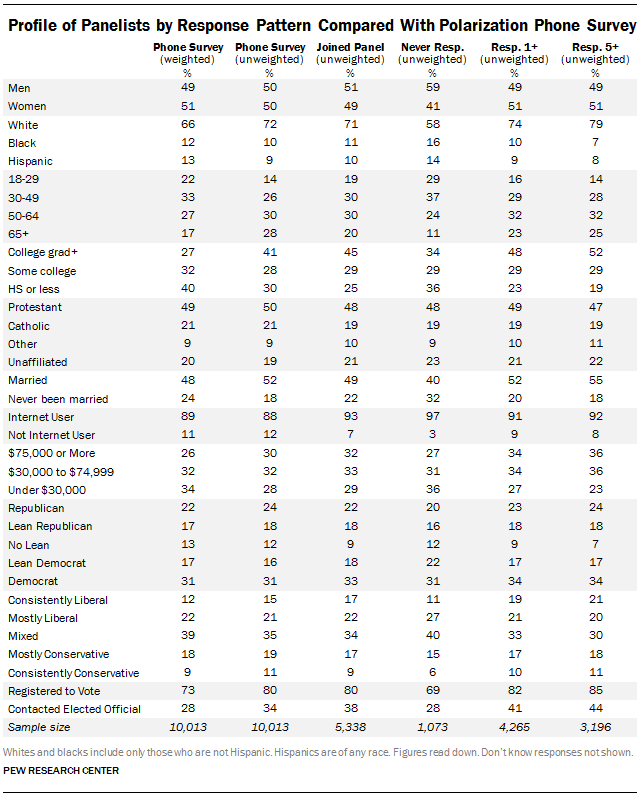
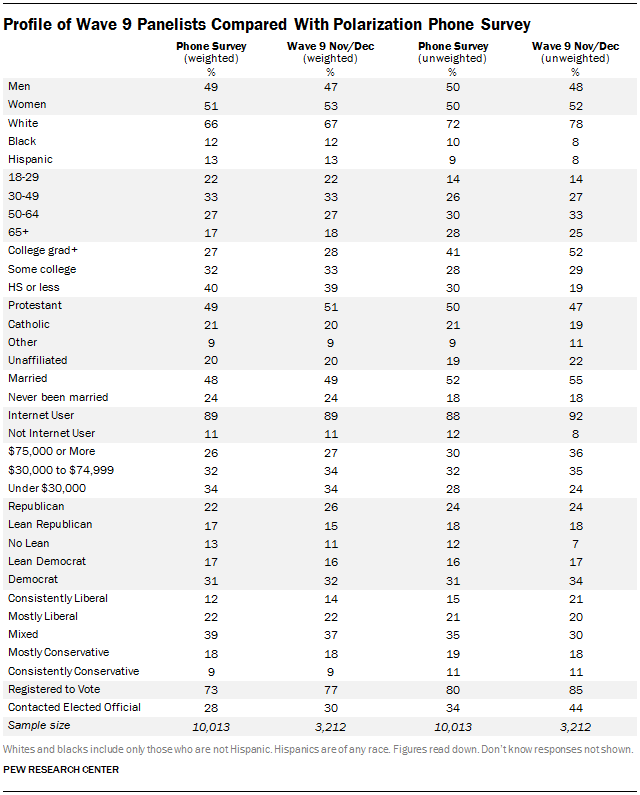
Nearly all surveys are subject to some degree of non-response bias, which is typically addressed using weighting. The telephone survey used to recruit the panelists had biases that are common to similar telephone surveys: compared with all adults, respondents were more likely to be white, older, better educated, married and politically engaged. The characteristics of those who agreed to join the panel and who took part in a typical panel wave were very similar to all telephone survey respondents, with a couple of notable exceptions: Those who joined and participated in the panel are even more likely than the phone respondents to be college graduates (e.g., 52% in Wave 9 vs. 41% in the phone survey) and to be active in politics (e.g., 44% have contacted an elected official in the past two years vs. 34% among the recruitment survey sample). We also observed a bias in the racial composition of the participants; 78% of those who took part in Wave 9 are non-Hispanic white, compared with 72% in the unweighted phone sample and 66% in the Census parameter.
All of the demographic biases noted here are corrected with post-stratification weighting, though doing so reduces the effective sample size of the study. Weighting also reduces the bias in political engagement. For example, 44% of the unweighted respondents to Wave 9 have contacted an elected official in the past two years; weighting reduces this to 30%, not much different from the weighted figure in the telephone survey (28%). Except for one wave that dealt specifically with the upcoming 2014 congressional election (Wave 7, Sept.-Oct. 2014), no effort was made to correct for the bias in political engagement through weighting. Weighting to correct such bias is controversial, given the absence of generally accepted parameters for this characteristic. Accordingly, future recruitment to the panel will attempt to mitigate this and other kinds of biases through differential rates of recruitment for certain groups (such as those with low levels of political interest), as well as higher incentives for hard-to-reach individuals.
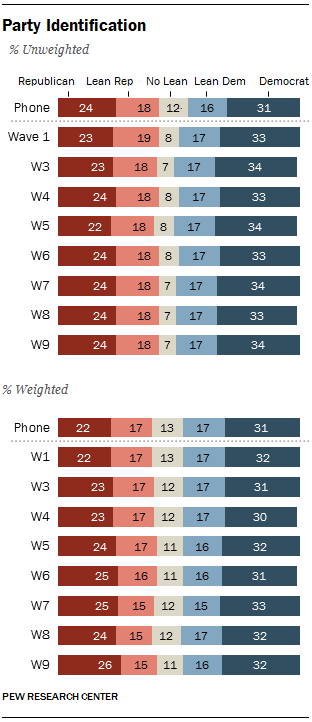
Because much of the work of Pew Research Center focuses on public opinion about politics and public policy, it is especially important that the panel be unbiased with respect to the partisanship and ideological orientation of the panelists. Across the eight waves of the panel conducted in 2014, the unweighted share of those who identify as Democratic varied between 33% and 34%, while the percent Republican varied between 22% and 24%. Compared with the unweighted telephone survey, Democrats were slightly more numerous in the unweighted panel waves (by 3-4 percentage points), while Republican numbers in the panel were nearly identical to those in the telephone survey. People who refused to lean toward either party were slightly underrepresented in the unweighted panel data (12% in the telephone survey, 7%-8% in the panel).
These differences are corrected by the weighting, which includes a parameter for party affiliation based on a rolling average of the three most recent political telephone surveys conducted by Pew Research Center.
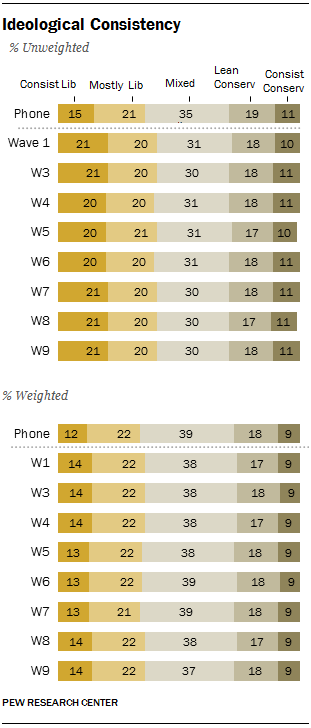
Beyond partisan affiliation, the panel includes a measure of the ideological orientation of each panelist, based on a
10-item scale of ideological consistency developed as a part of Pew Research Center’s
study of political polarization. On this measure using unweighted data, individuals classified as “consistently liberal” (having a score of +7 to +10 on a scale that varies between -10 and +10) are overrepresented in the panel, relative to the telephone survey: 20%-21% in the panel waves were in the consistently liberal category, compared with 15% in the phone survey. Conservatives are not underrepresented in the panel, relative to the telephone survey; instead, those in the “mixed” ideological group – with scores between -2 and +2 on the ideological consistency scale – are slightly less numerous in the panel (30%-31% in the panel, vs. 35% in the phone survey).
The standard panel weighting has the effect of nearly eliminating these ideological biases in a typical wave (across the eight waves, between 13%-14% of the weighted samples are classified as consistently liberal, vs. 12% in the weighted phone survey; 37%-39% are mixed, vs. 39% in the phone survey).
A 54% majority of those who were invited to join the panel agreed to do so, but not all of these individuals actually took part in panel surveys. Of those invited, 43% joined and responded to at least one wave in 2014, 33% responded to at least five waves and 20% responded to all waves.

As noted earlier, an experiment was conducted regarding how to ask respondents to join the panel. Half were invited to “participate in future surveys,” while the other half were invited to “join our American Trends Panel” to test whether a vague or specific request would perform better. Beyond how this invitation was phrased, all other characteristics of the panel and responsibilities of panelists were explained in exactly the same way.
A somewhat higher portion of the “future surveys” group (45%) than the “join the panel” group (42%) agreed to join the panel and responded to at least one survey. However, there was no difference between the two groups in joining and responding to five or more waves, or responding to all waves.
Panel Composition
Nearly all surveys are subject to some degree of non-response bias, which is typically addressed using weighting. The telephone survey used to recruit the panelists had biases that are common to similar telephone surveys: compared with all adults, respondents were more likely to be white, older, better educated, married and politically engaged. The characteristics of those who agreed to join the panel and who took part in a typical panel wave were very similar to all telephone survey respondents, with a couple of notable exceptions: Those who joined and participated in the panel are even more likely than the phone respondents to be college graduates (e.g., 52% in Wave 9 vs. 41% in the phone survey) and to be active in politics (e.g., 44% have contacted an elected official in the past two years vs. 34% among the recruitment survey sample). We also observed a bias in the racial composition of the participants; 78% of those who took part in Wave 9 are non-Hispanic white, compared with 72% in the unweighted phone sample and 66% in the Census parameter.
All of the demographic biases noted here are corrected with post-stratification weighting, though doing so reduces the effective sample size of the study. Weighting also reduces the bias in political engagement. For example, 44% of the unweighted respondents to Wave 9 have contacted an elected official in the past two years; weighting reduces this to 30%, not much different from the weighted figure in the telephone survey (28%). Except for one wave that dealt specifically with the upcoming 2014 congressional election (Wave 7, Sept.-Oct. 2014), no effort was made to correct for the bias in political engagement through weighting. Weighting to correct such bias is controversial, given the absence of generally accepted parameters for this characteristic. Accordingly, future recruitment to the panel will attempt to mitigate this and other kinds of biases through differential rates of recruitment for certain groups (such as those with low levels of political interest), as well as higher incentives for hard-to-reach individuals.

Because much of the work of Pew Research Center focuses on public opinion about politics and public policy, it is especially important that the panel be unbiased with respect to the partisanship and ideological orientation of the panelists. Across the eight waves of the panel conducted in 2014, the unweighted share of those who identify as Democratic varied between 33% and 34%, while the percent Republican varied between 22% and 24%. Compared with the unweighted telephone survey, Democrats were slightly more numerous in the unweighted panel waves (by 3-4 percentage points), while Republican numbers in the panel were nearly identical to those in the telephone survey. People who refused to lean toward either party were slightly underrepresented in the unweighted panel data (12% in the telephone survey, 7%-8% in the panel).
These differences are corrected by the weighting, which includes a parameter for party affiliation based on a rolling average of the three most recent political telephone surveys conducted by Pew Research Center.

Beyond partisan affiliation, the panel includes a measure of the ideological orientation of each panelist, based on a
10-item scale of ideological consistency developed as a part of Pew Research Center’s
study of political polarization. On this measure using unweighted data, individuals classified as “consistently liberal” (having a score of +7 to +10 on a scale that varies between -10 and +10) are overrepresented in the panel, relative to the telephone survey: 20%-21% in the panel waves were in the consistently liberal category, compared with 15% in the phone survey. Conservatives are not underrepresented in the panel, relative to the telephone survey; instead, those in the “mixed” ideological group – with scores between -2 and +2 on the ideological consistency scale – are slightly less numerous in the panel (30%-31% in the panel, vs. 35% in the phone survey).
The standard panel weighting has the effect of nearly eliminating these ideological biases in a typical wave (across the eight waves, between 13%-14% of the weighted samples are classified as consistently liberal, vs. 12% in the weighted phone survey; 37%-39% are mixed, vs. 39% in the phone survey).


Attrition
The American Trends Panel has suffered very little attrition throughout its first year. Response rates to individual surveys were quite stable across eight waves in 2014. Based on those who agreed to join the panel (including those who never took part in a wave), the Web response rate varied between 60% and 64%. The mail/phone group’s response rate varied more, but there was no consistent increase or decrease over time. The cumulative response rate, which accounts for the response rate to the recruitment telephone survey, agreement to join the panel, attrition from the panel and the response rate to each wave remained almost constant over time at approximately 3.5%.
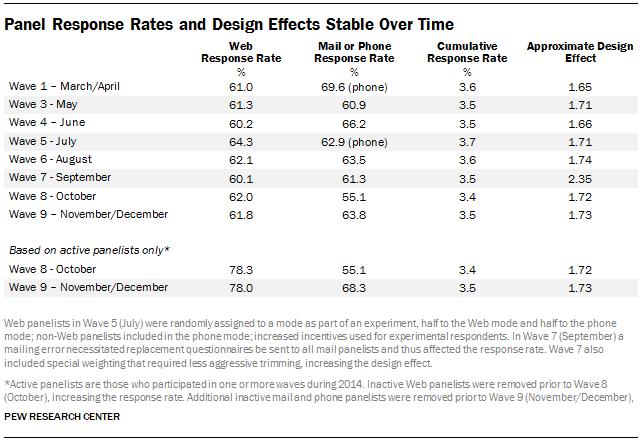
A survey’s design effect is a statistical measure of the extent to which the sampling design and the weighting affect the overall precision of the survey’s estimates. Larger design effects generally indicate lower precision, meaning that the effective sample size of the study is smaller than the actual sample size. The design effect for each wave of the panel was approximated as one plus the squared coefficient of variation of the weights. One way to interpret the design effect is as a measure of how much the data had to be weighted in order to look like the target population. On an unweighted basis, there was no meaningful change in the demographics of the panel over time (details about the demographic composition of the panel over time are presented in the appendix). On a weighted basis, the only differences were between wave 7 and all other waves on voter registration status due to a special pre-election weighting protocol that matched voter registration and U.S. House vote intention to the results from a September telephone survey.
A 54% majority of those who were invited to join the panel agreed to do so, but not all of these individuals actually took part in panel surveys. Of those invited, 43% joined and responded to at least one wave in 2014, 33% responded to at least five waves and 20% responded to all waves.

As noted earlier, an experiment was conducted regarding how to ask respondents to join the panel. Half were invited to “participate in future surveys,” while the other half were invited to “join our American Trends Panel” to test whether a vague or specific request would perform better. Beyond how this invitation was phrased, all other characteristics of the panel and responsibilities of panelists were explained in exactly the same way.
A somewhat higher portion of the “future surveys” group (45%) than the “join the panel” group (42%) agreed to join the panel and responded to at least one survey. However, there was no difference between the two groups in joining and responding to five or more waves, or responding to all waves.
Panel Composition
Nearly all surveys are subject to some degree of non-response bias, which is typically addressed using weighting. The telephone survey used to recruit the panelists had biases that are common to similar telephone surveys: compared with all adults, respondents were more likely to be white, older, better educated, married and politically engaged. The characteristics of those who agreed to join the panel and who took part in a typical panel wave were very similar to all telephone survey respondents, with a couple of notable exceptions: Those who joined and participated in the panel are even more likely than the phone respondents to be college graduates (e.g., 52% in Wave 9 vs. 41% in the phone survey) and to be active in politics (e.g., 44% have contacted an elected official in the past two years vs. 34% among the recruitment survey sample). We also observed a bias in the racial composition of the participants; 78% of those who took part in Wave 9 are non-Hispanic white, compared with 72% in the unweighted phone sample and 66% in the Census parameter.
All of the demographic biases noted here are corrected with post-stratification weighting, though doing so reduces the effective sample size of the study. Weighting also reduces the bias in political engagement. For example, 44% of the unweighted respondents to Wave 9 have contacted an elected official in the past two years; weighting reduces this to 30%, not much different from the weighted figure in the telephone survey (28%). Except for one wave that dealt specifically with the upcoming 2014 congressional election (Wave 7, Sept.-Oct. 2014), no effort was made to correct for the bias in political engagement through weighting. Weighting to correct such bias is controversial, given the absence of generally accepted parameters for this characteristic. Accordingly, future recruitment to the panel will attempt to mitigate this and other kinds of biases through differential rates of recruitment for certain groups (such as those with low levels of political interest), as well as higher incentives for hard-to-reach individuals.

Because much of the work of Pew Research Center focuses on public opinion about politics and public policy, it is especially important that the panel be unbiased with respect to the partisanship and ideological orientation of the panelists. Across the eight waves of the panel conducted in 2014, the unweighted share of those who identify as Democratic varied between 33% and 34%, while the percent Republican varied between 22% and 24%. Compared with the unweighted telephone survey, Democrats were slightly more numerous in the unweighted panel waves (by 3-4 percentage points), while Republican numbers in the panel were nearly identical to those in the telephone survey. People who refused to lean toward either party were slightly underrepresented in the unweighted panel data (12% in the telephone survey, 7%-8% in the panel).
These differences are corrected by the weighting, which includes a parameter for party affiliation based on a rolling average of the three most recent political telephone surveys conducted by Pew Research Center.

Beyond partisan affiliation, the panel includes a measure of the ideological orientation of each panelist, based on a
10-item scale of ideological consistency developed as a part of Pew Research Center’s
study of political polarization. On this measure using unweighted data, individuals classified as “consistently liberal” (having a score of +7 to +10 on a scale that varies between -10 and +10) are overrepresented in the panel, relative to the telephone survey: 20%-21% in the panel waves were in the consistently liberal category, compared with 15% in the phone survey. Conservatives are not underrepresented in the panel, relative to the telephone survey; instead, those in the “mixed” ideological group – with scores between -2 and +2 on the ideological consistency scale – are slightly less numerous in the panel (30%-31% in the panel, vs. 35% in the phone survey).
The standard panel weighting has the effect of nearly eliminating these ideological biases in a typical wave (across the eight waves, between 13%-14% of the weighted samples are classified as consistently liberal, vs. 12% in the weighted phone survey; 37%-39% are mixed, vs. 39% in the phone survey).


Attrition
The American Trends Panel has suffered very little attrition throughout its first year. Response rates to individual surveys were quite stable across eight waves in 2014. Based on those who agreed to join the panel (including those who never took part in a wave), the Web response rate varied between 60% and 64%. The mail/phone group’s response rate varied more, but there was no consistent increase or decrease over time. The cumulative response rate, which accounts for the response rate to the recruitment telephone survey, agreement to join the panel, attrition from the panel and the response rate to each wave remained almost constant over time at approximately 3.5%.

A survey’s design effect is a statistical measure of the extent to which the sampling design and the weighting affect the overall precision of the survey’s estimates. Larger design effects generally indicate lower precision, meaning that the effective sample size of the study is smaller than the actual sample size. The design effect for each wave of the panel was approximated as one plus the squared coefficient of variation of the weights. One way to interpret the design effect is as a measure of how much the data had to be weighted in order to look like the target population. On an unweighted basis, there was no meaningful change in the demographics of the panel over time (details about the demographic composition of the panel over time are presented in the appendix). On a weighted basis, the only differences were between wave 7 and all other waves on voter registration status due to a special pre-election weighting protocol that matched voter registration and U.S. House vote intention to the results from a September telephone survey.
Mobile Devices
Great care was taken to ensure that the Web portion of the panel was optimized for completion on a mobile device, specifically a mobile phone or a tablet. The combined share of respondents completing on a mobile device rose from 24% in wave 1 to 34% in wave 9. This was due to an increase in the use of smartphones to complete the survey, which rose from 16% to 26% while tablets remained between 8% and 9% of the total.
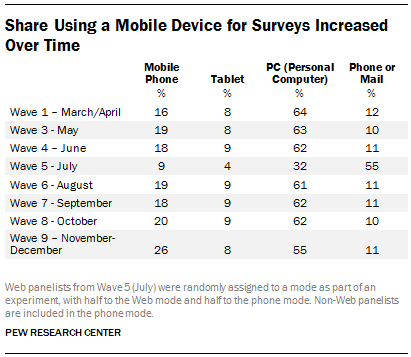
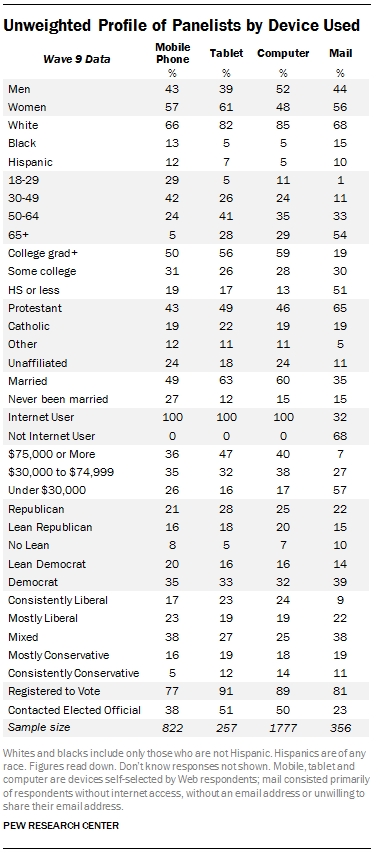
There are many demographic differences between those who chose to complete their survey on a mobile phone, tablet or PC. Both mobile phone and tablet respondents are more likely to be female than PC respondents. Compared with PC or tablet respondents, mobile phone respondents are younger, more likely to be non-white, never married, not registered to vote and to hold mixed, rather than consistent, ideological views. Tablet and PC respondents are more likely to be Republican or lean Republican, and to have contacted an elected official, than mobile respondents. Mobile phone respondents have the lowest average income, followed by PC respondents, with tablet respondents at the top. Mobile phone respondents have lower education than PC respondents.
Given that the kinds of people who took the surveys on a mobile device were also the kinds of people underrepresented in the panel (relative to the benchmarks), it is critically important that Web surveys be optimized for these kinds of devices. It may also be beneficial in future panel recruitment to stress that the surveys can be taken anytime, anywhere, on a mobile phone or tablet.
A 54% majority of those who were invited to join the panel agreed to do so, but not all of these individuals actually took part in panel surveys. Of those invited, 43% joined and responded to at least one wave in 2014, 33% responded to at least five waves and 20% responded to all waves.

As noted earlier, an experiment was conducted regarding how to ask respondents to join the panel. Half were invited to “participate in future surveys,” while the other half were invited to “join our American Trends Panel” to test whether a vague or specific request would perform better. Beyond how this invitation was phrased, all other characteristics of the panel and responsibilities of panelists were explained in exactly the same way.
A somewhat higher portion of the “future surveys” group (45%) than the “join the panel” group (42%) agreed to join the panel and responded to at least one survey. However, there was no difference between the two groups in joining and responding to five or more waves, or responding to all waves.
Panel Composition
Nearly all surveys are subject to some degree of non-response bias, which is typically addressed using weighting. The telephone survey used to recruit the panelists had biases that are common to similar telephone surveys: compared with all adults, respondents were more likely to be white, older, better educated, married and politically engaged. The characteristics of those who agreed to join the panel and who took part in a typical panel wave were very similar to all telephone survey respondents, with a couple of notable exceptions: Those who joined and participated in the panel are even more likely than the phone respondents to be college graduates (e.g., 52% in Wave 9 vs. 41% in the phone survey) and to be active in politics (e.g., 44% have contacted an elected official in the past two years vs. 34% among the recruitment survey sample). We also observed a bias in the racial composition of the participants; 78% of those who took part in Wave 9 are non-Hispanic white, compared with 72% in the unweighted phone sample and 66% in the Census parameter.
All of the demographic biases noted here are corrected with post-stratification weighting, though doing so reduces the effective sample size of the study. Weighting also reduces the bias in political engagement. For example, 44% of the unweighted respondents to Wave 9 have contacted an elected official in the past two years; weighting reduces this to 30%, not much different from the weighted figure in the telephone survey (28%). Except for one wave that dealt specifically with the upcoming 2014 congressional election (Wave 7, Sept.-Oct. 2014), no effort was made to correct for the bias in political engagement through weighting. Weighting to correct such bias is controversial, given the absence of generally accepted parameters for this characteristic. Accordingly, future recruitment to the panel will attempt to mitigate this and other kinds of biases through differential rates of recruitment for certain groups (such as those with low levels of political interest), as well as higher incentives for hard-to-reach individuals.

Because much of the work of Pew Research Center focuses on public opinion about politics and public policy, it is especially important that the panel be unbiased with respect to the partisanship and ideological orientation of the panelists. Across the eight waves of the panel conducted in 2014, the unweighted share of those who identify as Democratic varied between 33% and 34%, while the percent Republican varied between 22% and 24%. Compared with the unweighted telephone survey, Democrats were slightly more numerous in the unweighted panel waves (by 3-4 percentage points), while Republican numbers in the panel were nearly identical to those in the telephone survey. People who refused to lean toward either party were slightly underrepresented in the unweighted panel data (12% in the telephone survey, 7%-8% in the panel).
These differences are corrected by the weighting, which includes a parameter for party affiliation based on a rolling average of the three most recent political telephone surveys conducted by Pew Research Center.

Beyond partisan affiliation, the panel includes a measure of the ideological orientation of each panelist, based on a
10-item scale of ideological consistency developed as a part of Pew Research Center’s
study of political polarization. On this measure using unweighted data, individuals classified as “consistently liberal” (having a score of +7 to +10 on a scale that varies between -10 and +10) are overrepresented in the panel, relative to the telephone survey: 20%-21% in the panel waves were in the consistently liberal category, compared with 15% in the phone survey. Conservatives are not underrepresented in the panel, relative to the telephone survey; instead, those in the “mixed” ideological group – with scores between -2 and +2 on the ideological consistency scale – are slightly less numerous in the panel (30%-31% in the panel, vs. 35% in the phone survey).
The standard panel weighting has the effect of nearly eliminating these ideological biases in a typical wave (across the eight waves, between 13%-14% of the weighted samples are classified as consistently liberal, vs. 12% in the weighted phone survey; 37%-39% are mixed, vs. 39% in the phone survey).


Attrition
The American Trends Panel has suffered very little attrition throughout its first year. Response rates to individual surveys were quite stable across eight waves in 2014. Based on those who agreed to join the panel (including those who never took part in a wave), the Web response rate varied between 60% and 64%. The mail/phone group’s response rate varied more, but there was no consistent increase or decrease over time. The cumulative response rate, which accounts for the response rate to the recruitment telephone survey, agreement to join the panel, attrition from the panel and the response rate to each wave remained almost constant over time at approximately 3.5%.

A survey’s design effect is a statistical measure of the extent to which the sampling design and the weighting affect the overall precision of the survey’s estimates. Larger design effects generally indicate lower precision, meaning that the effective sample size of the study is smaller than the actual sample size. The design effect for each wave of the panel was approximated as one plus the squared coefficient of variation of the weights. One way to interpret the design effect is as a measure of how much the data had to be weighted in order to look like the target population. On an unweighted basis, there was no meaningful change in the demographics of the panel over time (details about the demographic composition of the panel over time are presented in the appendix). On a weighted basis, the only differences were between wave 7 and all other waves on voter registration status due to a special pre-election weighting protocol that matched voter registration and U.S. House vote intention to the results from a September telephone survey.
Mobile Devices
Great care was taken to ensure that the Web portion of the panel was optimized for completion on a mobile device, specifically a mobile phone or a tablet. The combined share of respondents completing on a mobile device rose from 24% in wave 1 to 34% in wave 9. This was due to an increase in the use of smartphones to complete the survey, which rose from 16% to 26% while tablets remained between 8% and 9% of the total.

There are many demographic differences between those who chose to complete their survey on a mobile phone, tablet or PC. Both mobile phone and tablet respondents are more likely to be female than PC respondents. Compared with PC or tablet respondents, mobile phone respondents are younger, more likely to be non-white, never married, not registered to vote and to hold mixed, rather than consistent, ideological views. Tablet and PC respondents are more likely to be Republican or lean Republican, and to have contacted an elected official, than mobile respondents. Mobile phone respondents have the lowest average income, followed by PC respondents, with tablet respondents at the top. Mobile phone respondents have lower education than PC respondents.
Given that the kinds of people who took the surveys on a mobile device were also the kinds of people underrepresented in the panel (relative to the benchmarks), it is critically important that Web surveys be optimized for these kinds of devices. It may also be beneficial in future panel recruitment to stress that the surveys can be taken anytime, anywhere, on a mobile phone or tablet.

Javascript
One reason Web surveys have become popular is the ability to add arresting visuals and interactivity to the questionnaire. But most content of this nature may require respondents to have JavaScript, a computer programming language, enabled on their devices. JavaScript makes it possible to use drag-and-drop features, scale sliders and other widgets in a questionnaire. But among our Web panelists, approximately 15% do not have Javascript-enabled devices and thus cannot see such features. These respondents tend to be older (33% aged 65+, compared with 19% among those with JavaScript) and more likely to be non-Hispanic whites (86% among non-JavaScript panelists, vs. 78% among those with JavaScript).
Fortunately, previous research indicates that the flashier tools JavaScript makes possible do not improve and may in fact degrade data quality. There are legitimate and useful applications for JavaScript in Web surveys (e.g., the ability to compute a running sum of percentages that must add to 100%). Our approach has been to program non-Javascript versions of questions to be automatically substituted for respondents whose computers are flagged as not having JavaScript.
Cost
 As noted earlier, an experiment was conducted regarding how to ask respondents to join the panel. Half were invited to “participate in future surveys,” while the other half were invited to “join our American Trends Panel” to test whether a vague or specific request would perform better. Beyond how this invitation was phrased, all other characteristics of the panel and responsibilities of panelists were explained in exactly the same way.
 Because much of the work of Pew Research Center focuses on public opinion about politics and public policy, it is especially important that the panel be unbiased with respect to the partisanship and ideological orientation of the panelists. Across the eight waves of the panel conducted in 2014, the unweighted share of those who identify as Democratic varied between 33% and 34%, while the percent Republican varied between 22% and 24%. Compared with the unweighted telephone survey, Democrats were slightly more numerous in the unweighted panel waves (by 3-4 percentage points), while Republican numbers in the panel were nearly identical to those in the telephone survey. People who refused to lean toward either party were slightly underrepresented in the unweighted panel data (12% in the telephone survey, 7%-8% in the panel).
 Beyond partisan affiliation, the panel includes a measure of the ideological orientation of each panelist, based on a 10-item scale of ideological consistency developed as a part of Pew Research Center’s study of political polarization. On this measure using unweighted data, individuals classified as “consistently liberal” (having a score of +7 to +10 on a scale that varies between -10 and +10) are overrepresented in the panel, relative to the telephone survey: 20%-21% in the panel waves were in the consistently liberal category, compared with 15% in the phone survey. Conservatives are not underrepresented in the panel, relative to the telephone survey; instead, those in the “mixed” ideological group – with scores between -2 and +2 on the ideological consistency scale – are slightly less numerous in the panel (30%-31% in the panel, vs. 35% in the phone survey).


 There are many demographic differences between those who chose to complete their survey on a mobile phone, tablet or PC. Both mobile phone and tablet respondents are more likely to be female than PC respondents. Compared with PC or tablet respondents, mobile phone respondents are younger, more likely to be non-white, never married, not registered to vote and to hold mixed, rather than consistent, ideological views. Tablet and PC respondents are more likely to be Republican or lean Republican, and to have contacted an elected official, than mobile respondents. Mobile phone respondents have the lowest average income, followed by PC respondents, with tablet respondents at the top. Mobile phone respondents have lower education than PC respondents.


