Determining the ideological composition of news outlets’ audiences
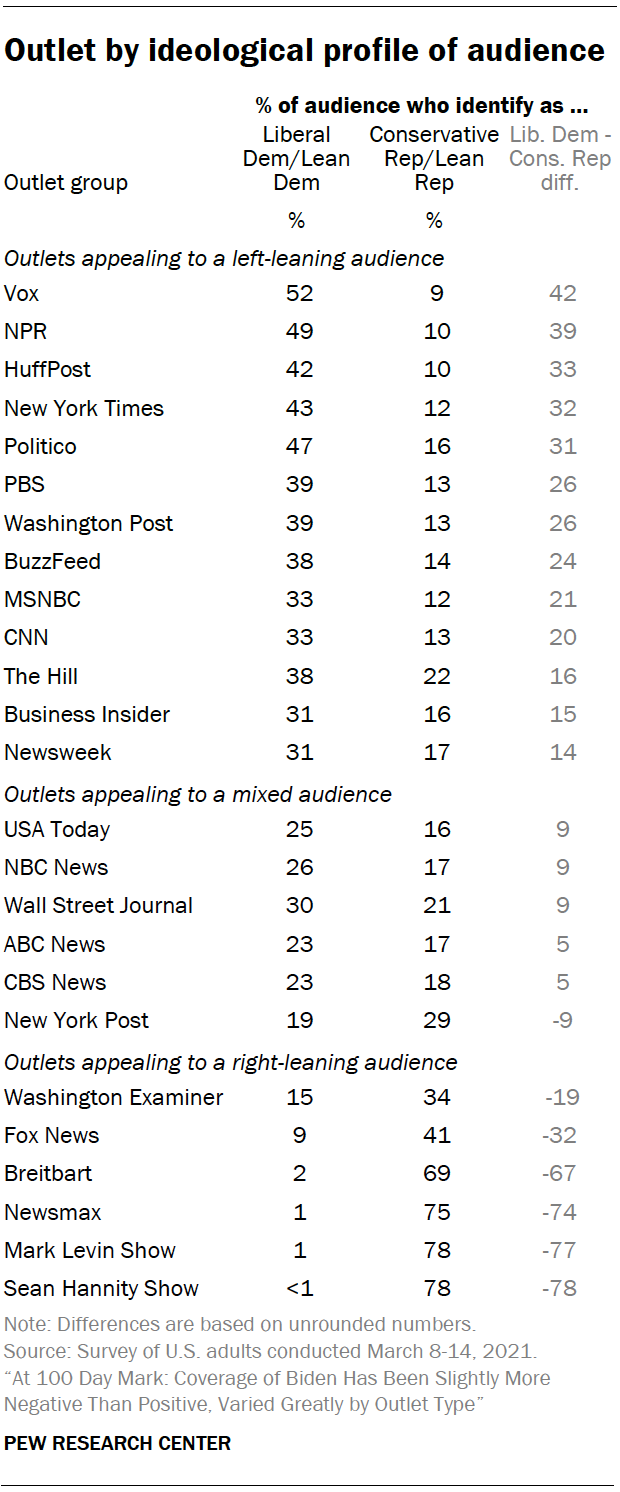
 For the analysis of both the content and survey data, each of the 25 news outlets included in this study is grouped according to the ideological composition of its audience. This grouping is based on the ratio of the proportion of the audience who self-identify as liberal Democrats (including independents who lean Democrat) to the proportion that identify as conservative Republicans (including independents who lean Republican).
A survey conducted between March 8 to March 14, 2021, asked respondents to indicate whether they got political news from 25 national news outlets in the past week (more details on the survey are available in the methodology. An outlet is considered to have a left-leaning audience if the proportion of all audience members that identify as liberal Democrats is at least two-thirds higher than the proportion that identify as conservative Republicans. Alternatively, an outlet is considered to have a right-leaning audience if the proportion of all audience members that identify as conservative Republicans is at least two-thirds higher than the proportion that identify as liberal Democrats. And an outlet is classified as having a mixed audience if neither liberal Democrats nor conservative Republicans make up at least two-thirds more of the audience than the other.
Grouping respondents by media diet
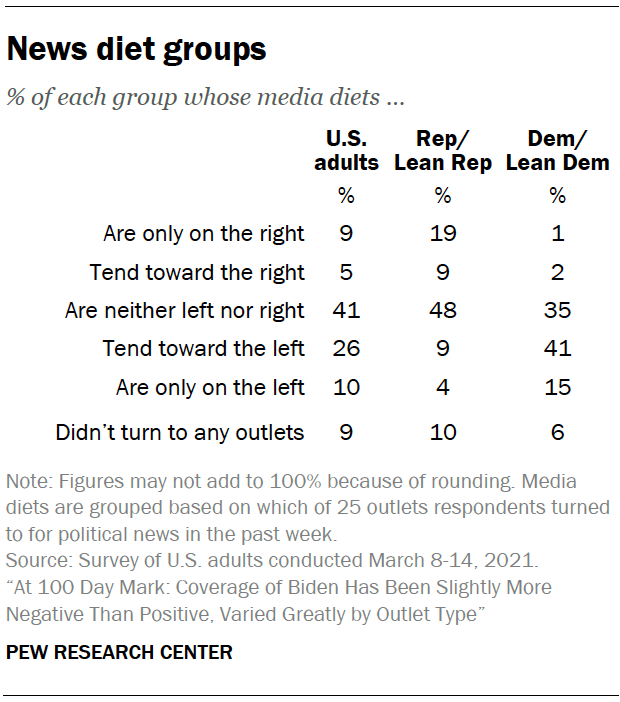
Respondents were grouped into six media diet groups based on the outlets they said they turned to in the past week for political news. News outlets’ audiences were defined as left-leaning, right-leaning, or mixed based on the ideological composition of their audiences.
Researchers assigned each outlet a value based on these ideological compositions. Outlets with a left-leaning audience were given a value of 0; outlets with a mixed audience were given a value of 1; and outlets with a right-leaning audience were given a value of 2. For each respondent, researchers then calculated the mean of the values of the outlets they turned to. Respondents were grouped based on these means.
 The detailed description of each category:
- U.S. adults whose media diets are only on the right – Respondents whose outlet mean was 2.
- U.S. adults whose media diets tend toward the right – Respondents whose outlet mean was from 1.5 to 1.99.
- U.S. adults whose media diets are neither on the left nor on the right – Respondents whose outlet mean was 0.51 to 1.49.
- U.S. adults whose media diets tend toward the left – Respondents whose outlet mean was from 0.01 to 0.5.
- U.S. adults whose media diets are only on the left – Respondents whose outlet mean was 0.
- U.S. adults who didn’t turn to any outlets – Respondents who didn’t get political news from any of the 25 outlets in the past week.


