Introduction
As pervasive as information and communications technologies are in modern society, there is a great deal of variation in what technologies people have, how they use them, and what they think of them. Many of us may know someone who is the first person on the block to get the latest gadget. He – and it’s more likely than not to be a male – is deep into technology, always upgrading to the latest thing, uploading digital content to the internet, and perhaps wondering about those who choose to live life in the technological slow lane. Others may follow along fairly closely in purchasing new devices or applications. Some of these folks may find this extra connectivity good. Others may not be so sure.
There are other varieties of ICT users. Some have little but like ICTs a lot; many of them convey a sense that they might do more with ICTs if they had more. Other users have a relative abundance of technology, but are unenthusiastic about the gadgetry they have accumulated. They might use email because they have to – perhaps they have friends or family members who have hectored them into having online access – but they could contentedly live their lives without the internet or a cell phone.
This report explores the patterns of adoption and use of information and communication technologies (ICTs) by developing a typology of users of these things. The typology places users into different categories depending on their technology assets (the information and communication appliances they use), their actions, (how they use their information devices and services), and their attitudes about ICTs (how they feel about information and communication technology).
A broader look at what it means to be connected to cyberspace
This report represents the Pew Internet Project’s first comprehensive look at people’s evolving relationships to cyberspace at a time when accessing online content no longer necessarily means walking over to a weighty beige box and taking a seat. Lighter laptop computers and high-speed networks (wireless and otherwise) give people the opportunity to get digital content on the go and do new things with computing – such as making a phone call. More versatile “smart devices” make emailing, phone calling, and downloading digital content possible with a very portable device. Pictures – photographs and videos – can be created and shared almost instantly, and Web cameras can put people in touch face-to-face over distance in real-time using broadband connections.
What went into the typology
The typology focuses on adult Americans with access to the basics of modern communications technology – the internet or the cell phone. When this survey was completed in April 2006, 73% of adult Americans said they were internet users and 73% said they used a cell phone. This comes to 85% of all Americans who are either internet or cell phone users, with the remainder lacking access to both of those communication services. For technology assets, the survey queried users not only about information appliances that enable communication, but also those that facilitate the consumption and transmission of digital content.
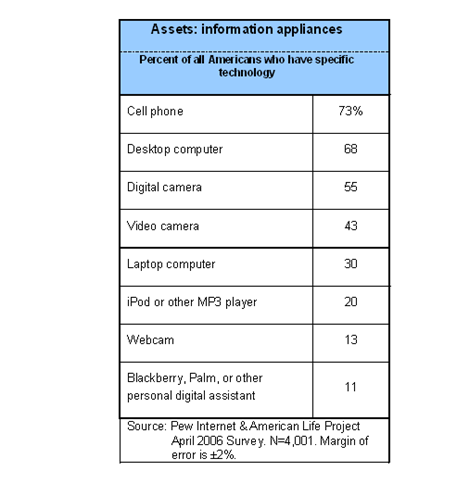
On average, Americans reported that they had just over 3 of these 8 information goods. When excluding two widely disseminated devices – the desktop computer and cell phone – Americans have on average 1.7 of the six remaining items.
These eight information tools were inputs to the typology; that is, they were among the criteria that helped determine whether a respondent fit into one category or another. The type of network access at home, i.e., whether the respondent was one of the 42% with broadband at home, was also used to develop the typology.1
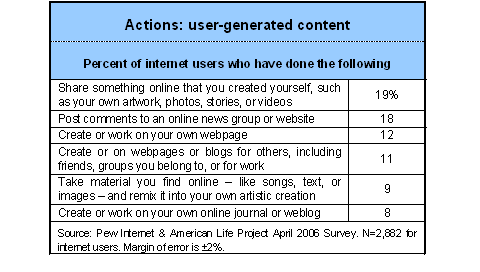
The survey also focused on a number of activities regarding user-generated content, as well as activities people might undertake online or with a mobile online device. The tables below summarize the gadget-enabled activities respondents said they had done.
The table below shows whether online users have ever done a specified activity and if they did it “yesterday,” the latter yielding a picture of what internet users are doing with respect to a set of online activities on a typical day.
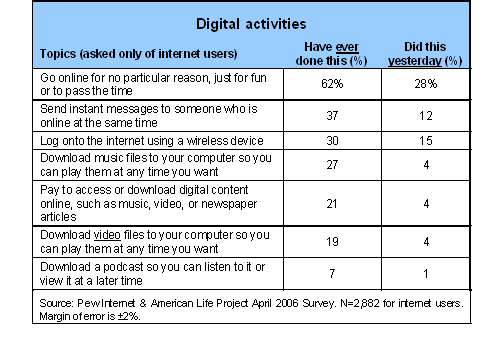
Out of the seven activities asked about, internet users, on average, have tried nearly two of these activities; on a typical day, most online users do not do any of the digital activities listed and the average number of such “daily” activities is 0.64.
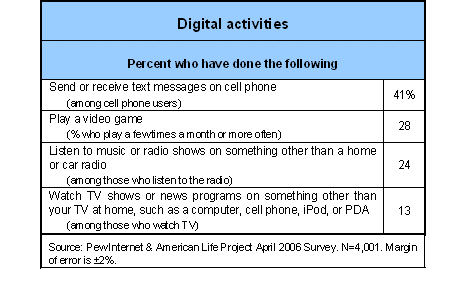
Other digital activities figure prominently in the typology. These include using the cell phone to send text messages, watching television on a device other than a TV, listening to the radio on a device other than a radio, and play electronic video games (on a computer, the internet, or using a game console such as an Xbox). Also figuring into the typology were other uses of the cell phone, such as surfing the internet, playing games, listening to music, and watching or recording video.
Respondents also received a number of questions about their attitudes toward technology and the proliferation of information. Other attitudinal questions probed the stresses that technology can bring and the benefits it can offer.
Two questions explored people’s general attitudes about technology. The first unfolded as follows: “Some people say they feel overloaded with information these days, considering all the TV news shows, magazines, newspapers, and computer information services. Others say they like having so much information to choose from. How about you… do you feel overloaded or do you like having so much information available?” In response:
- 27% of all respondents said they feel overloaded, and;
- 67% of all respondents said they like having so much information available.
The second question addressed whether people think computers and technology give people more or less control over their lives – or make no difference. In response:
- 48% of all respondents said computers and technology give them more control over their lives.
- 16% say computers and technology give them less control over their lives
- 29% said these things make no difference.
With respect to stresses or benefits technology can offer, technology users – the 85% of respondents who use the internet or have a cell phone – were asked how well several statements about these topics describe them.
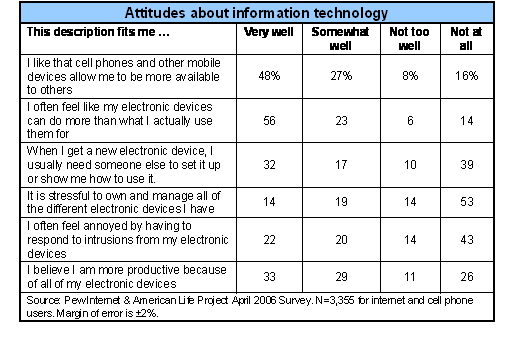
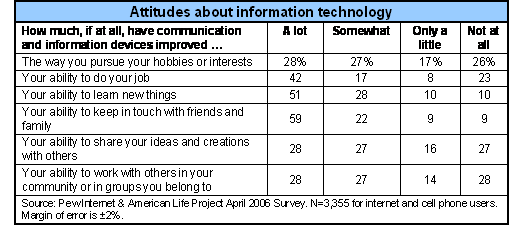
Americans sort into ten distinct groups when examining their technology assets, activities, and attitudes.
Below is a thumbnail sketch of each of ten kinds of technology users. As already noted, respondents were asked whether they have any of eight devices: a desktop computer, a laptop computer, a cell phone, personal digital assistant (PDA), a digital camera, a video camera, or a Web cam. The groups are presented in order of most to least in terms of possession of these gadgets. The table also displays the degree to which they have access to a key factor that is a prerequisite to using information technology as a launching pad to cyberspace – a home broadband connection.
The typology’s first nine groups were developed using the 85% of respondents who have cell phones or use the internet. The Appendix to the report presents detailed demographic data on each group. The Appendix also presents responses to the typology’s key questions for each group.
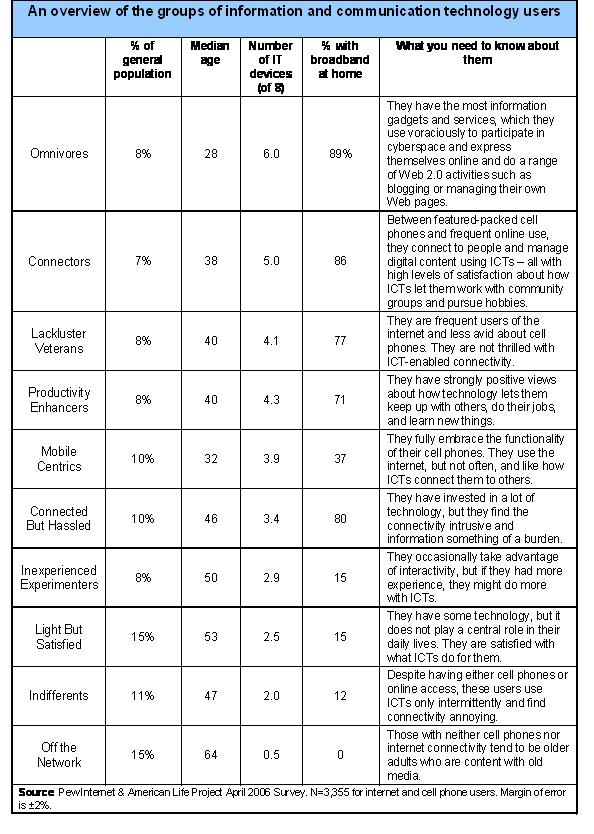
We find that there are differences in use and attitudes among people even when they own the same devices. Those who want to generalize about where Americans stand with technology may obscure the true picture of the role of technology in American life more than illuminate it. Some people may have lots of technology at their disposal, use it frequently and for a range of purposes, and like what technology does for them. Others may have relatively few of the latest gadgets, use what they have only modestly, and find that technology is more burden than blessing. The typology captures users at either end of these extremes, but also variations in between, especially among those who have lots of technology and are not terribly positive about its impact.
Much of the remainder of this report presents in detail the profiles of these ten groups. For ease of exposition, the groups are presented in sections that classify collections of groups as elites (four groups), “mid-tech” users (two groups), and the “less connected” (three groups). The remaining group is made up of the 15% of respondents who have neither internet connections nor cell phones.
Methodology for creating the typology
The inputs for this typology were respondents’ answers to questions pertaining to technology assets (i.e., the information goods and services which they have), actions (i.e., how they use various information devices and applications), and attitudes (i.e., their perceptions about the benefits and stresses of various information goods and services).
In constructing the typology, a statistical cluster analysis was performed only on those respondents who identified themselves as having cell phones or being internet users (they received most of the survey’s questions on technology use and attitudes). This came to 85% of the sample. Several different cluster solutions were evaluated for their effectiveness in producing cohesive groups that were distinct from one another, large enough in size to be analytically useful, and substantively meaningful. The final solution selected was judged to be strongest on a statistical basis and to be most persuasive from a substantive perspective.
Cluster analysis does not produce a definitive solution; instead, the analyst usually has a choice among several possible solutions that are similar in their statistical properties. The large sample of cell phone or internet users – 3,355 respondents – made it possible to have a relatively large number of groups, thus allowing for groups that were more distinct from one another. Among other things, this allowed us to identify the relatively small group of technology users who were particularly heavy users of information and communications technology (the Omnivore group, at 8%). With group sizes ranging from 7% to 15% of the general population, the solution with 9 clusters resulted in groups of adequate sizes – no fewer than 229 cases and a maximum of 675 (see the Appendix for details).


