Introduction and findings
After getting the basics about those who are active in religious organizations, we examined their broad patterns of involvement in groups by looking at the number of groups that a person was active in and the number hours devoted to these groups.
The average American adult is active in 3.51 groups of the various types queried in the survey, and the average person spends 6.54 hours per week in group activities.6
By comparison, the average number of groups that members of religious or spiritual organizations are active in is 5.61, and those who are not involved with religious groups participate in 2.11 groups.
Exploring this involvement more, we classified people into four categories, depending on how many groups they were involved with (remember, the survey covered 28 different kinds of groups):
- High Involvement: those who participate in 8-28 groups
- Medium Involvement: those who participate in 3-7 groups
- Low Involvement: those who participate in 1-2 group(s)
- No Involvement: those who participate in 0 groups
We then compared those active in religious or spiritual organizations with those not active in such organizations, with results shown in Figure 3.
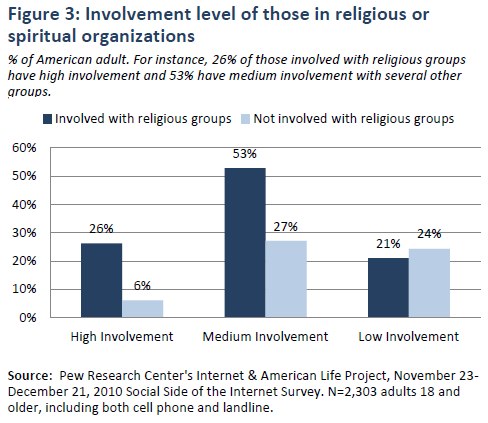
Those involved with religious groups tended towards high or medium involvement, while those who are not members of religious groups tended toward medium or low involvement. From Figure 3, we see that for those involved with religious groups, 26% have high involvement and 53% have medium involvement with several other groups.
Comparatively, only 6% of those not involved with religious groups have a high involvement. Some 43% of those not connected to religious groups have no connection to any of the other types of groups that were involved in this survey.
In addition to involvement by number of groups, we also examined engagement by number of weekly hours devoted to all groups and organizations.
To examine this aspect, we classified people into four categories:
- Heavily engaged: those who devote 6 or more hours per week
- Medium engaged: those who devote 3- 5 hours per week
- Lightly engaged: those who devote 1-2 hours per week
- Not engaged: those who devote 0 hours per week
We then compared those active in religious or spiritual organizations with those not active in such organizations, with results shown in Figure 4.
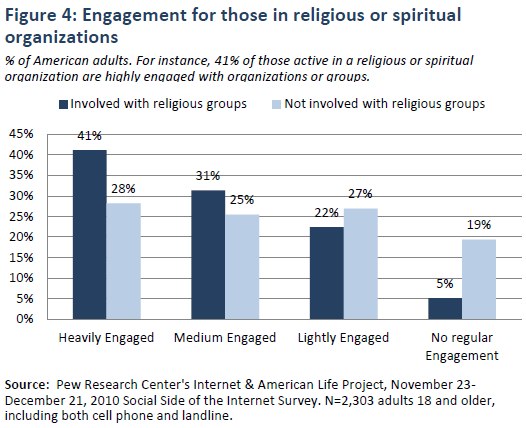
As shown in Figure 4, we found that 41% of those active in a religious or spiritual organization are highly engaged, devoting 6 or more hours per week to various organizations or groups. Additionally, another 31% are intermediately engaged, devoting 3-5 hours per week. Only 5% of these respondents devote no weekly time to their organization or groups. Those who are involved in religious groups spend an average of 7.5 hours per week in group activities compared with 5.4 hours for those not members of a religious group.
Other organizations to which religiously active Americans belong
Of the 28 groups that we surveyed, religiously active Americans are involved in greater percentages in every type of group save one (gaming groups) than their non-religious peers.
- 35% are active in sports or recreation leagues for themselves or for their children (versus 17% for the non-religious).
- 34% are active in charitable or volunteer organizations such as Habitat for Humanity or the Humane Society (versus 15% for the non-religious).
- 32% are active in consumer groups such as AAA or coupon-sharing groups (versus 18% for the non-religious).
- 30% are active in community groups or neighborhood associations (versus 11% for the non-religious).
- 30% are active in support groups for people with a particular illness or personal situation (versus 11% for the non-religious).
- 29% are active in professional or trade associations for people in their occupations (versus 14% for the non-religious).
- 23% are active in hobby groups or clubs (versus 13% for the non-religious).
- 23% are active in national or local organizations for older adults such as the American Association of Retired Persons (AARP) (versus 10% for the non-religious).
- 22% are active in political parties or organizations (versus 10% for the non-religious).
- 20% are active in alumni associations (versus 10% for the non-religious).
- 20% are active in parent groups or organizations such as the PTA or local parent support groups (versus 8% for the non-religious).
- 19% are active in performance or arts groups, such as a choir, dance group, or craft guild (versus 5% for the non-religious).
- 18% are active in literary, discussion, or study groups such as book clubs (versus 6% for the non-religious).
- 16% are active in youth groups such as the Scouts, YMCA, or 4-H club (versus 5% for the non-religious).
- 14% are active in fan groups for a particular sports team or athlete (versus 8% for the non-religious).
- 12% are active in social or fraternal clubs, sororities or fraternities (versus 6% for the non-religious).
- 11% are active in veterans organizations such as the American Legion or VFW (versus 4% for the non-religious).
- 10% are active in labor unions (versus 6% for the non-religious).
- 10% are active in environmental groups (versus 6% for the non-religious).
- 9% are active in ethnic or cultural groups (versus 3% for the non-religious).
- 8% are active in sports fantasy leagues (versus 6% for the non-religious).
- 8% are active in fan groups for a particular TV show, movie, celebrity, or musical performer (versus 4% for the non-religious).
- 8% are active in travel clubs (versus 3% for the non-religious).
- 7% are active in farm organizations (versus 2% for the non-religious).
- 5% say they are active in another kind of group that was not mentioned in the Pew Internet list (versus 3% for the non-religious).
- 4% are active in fan groups for a particular brand, company, or product (versus 3% for the non-religious).
The only group for which the religiously active do not participate in greater percentages is gaming communities, where 5% of the religious are active versus 6% for the non-religious.
What motivates group membership by those in religious organizations
With this background on involvement and engagement, we were interested in what motivated these people to become active in their groups and organizations. We asked a series of questions about possible motives that might drive people to participate in organizations. The results are reported in Figure 5. It is important to note that respondents’ answers reflected their views about membership in all the groups they participate in, not just the religious groups.
The pattern is clear: Those who are religiously active are more likely than others to see that the organizations of which they are members are more personally rewarding and have greater impact, especially off-line.
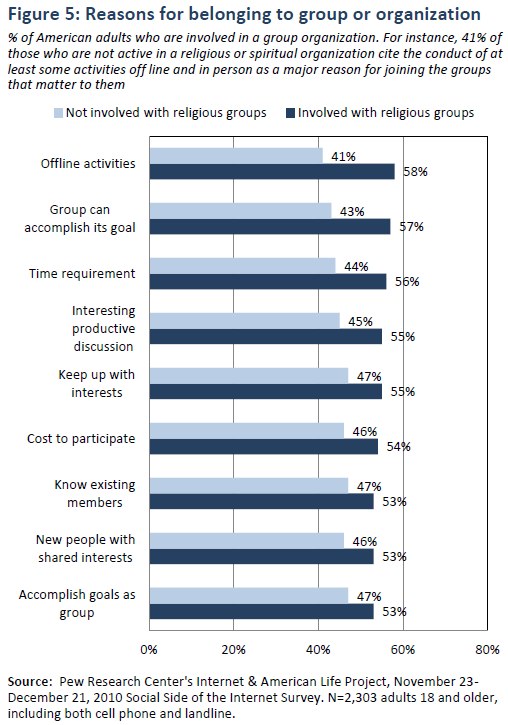
Some 58% of those who are active in a religious or spiritual organization cite the conduct of at least some activities off line and in person as a major reason for joining the groups that matter to them. This was closely followed by a belief that the group can accomplish its goal (57%) and the time required for participation (56%).
In contrast, those who were not members of religious or spiritual organizations said these reasons were the most important for joining their groups: knowing existing members, keeping up with interests, and accomplishing something as part of a group that one can’t accomplish individually (all at approximately 47%).
Religion and politics
We wanted to gauge the political affiliations of those active in religious or spiritual organizations. Since such political positions can sometimes be nuanced, we explored this matter in three different ways:
- What political party they belonged to
- Whether they leaned politically toward one party or another
- Where on the political spectrum they placed themselves
Results are shown in Figure 6.
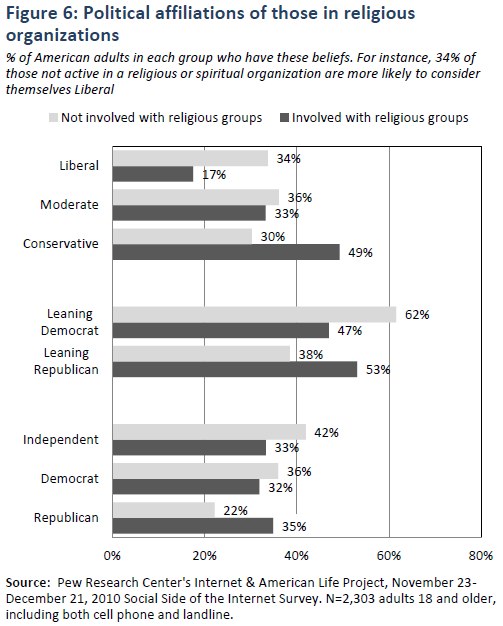
From Figure 6, we can see that 35% of those active in a religious or spiritual organization are more likely to consider themselves Republican, with slightly less percentages for both Democrat (32%) and Independent (33%). It is interesting to note the political alignment of those not active in religious or spiritual organizations, with 22% considering themselves Republican, 36% Democrat, and 42% Independent.
When also asked which party they leaned toward versus aligned with, 53% of those active in a religious or spiritual organization leaned Republican and 47% leaned Democrat. The “Leaning Republican” and “Leaning Democratic” are the sum of those who say they support that party and those who say they lean toward that party.
As for where they placed themselves on the political spectrum, 49% of those in a religious or spiritual organization considered themselves Conservative, with 33% being Moderate and 17% being Liberal.
So, these survey findings confirm to a degree the analysis by Robert Putnam and David Campbell,7 who have argued that religious sensibilities are an important factor leading to political polarization as religious group members skew conservative and non-religious group members trend liberal.
However, in contrast to the arguments of Putnam and Campbell, our survey found that there appears to be a substantial middle of both religious and secular moderates (33% of those who are active in religious groups). We also found notable percentages of religious liberals (17% of those who are active in religious groups) and, conversely, secular conservatives, as shown in Figure 6 (i.e., those conservatives who do not are active in any religious group).
The trust, efficacy, and community view of the religiously active
We wanted to measure how those active in religious groups view others, themselves, and their communities.
For insight into people’s sense of trust, we asked, “Generally speaking, would you say that most people can be trusted or that you can’t be too careful in dealing with people?” The results are shown in Figure 7.
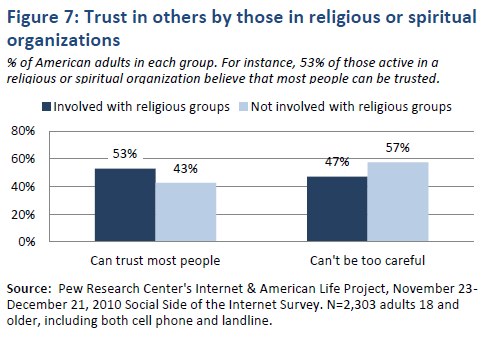
From Figure 7, 53% of those active in a religious or spiritual organization believe that most people can be trusted, significantly higher than those not active in such organizations (43%).
On the issue of personal efficacy, we asked respondents, “Overall, how much impact do you think people like you can have in making your community a better place to live — a big impact, a moderate impact, a small impact, or no impact at all?” Results are shown in Figure 8.
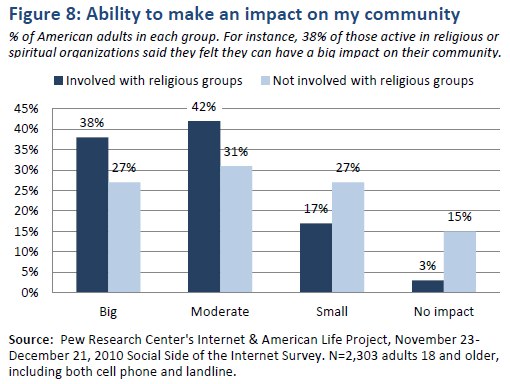
From Figure 8, some 38% of those active in religious or spiritual organizations said they felt they can have a big impact; 42% said they can have a moderate impact; 27% said they have a small impact; and 3% said they felt they have no impact. The belief in having a big or moderate impact is substantially higher than those not involved in a religious organization.
We were also interested in how people view the communities in which they live (Figure 9).
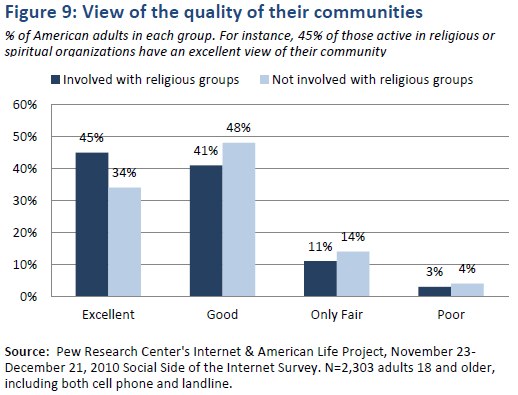
As one can see from Figure 9, 45% of those active in religious or spiritual organizations have an excellent view of their community compared with 34% of those not active in these organizations, again substantially higher.


