States
- Alabama
- Alaska
- Arkansas
- Arizona
- California
- Colorado
- Connecticut
- Delaware
- District of Columbia
- Florida
- Georgia
- Hawaii
- Idaho
- Illinois
- Indiana
- Iowa
- Kansas
- Kentucky
- Louisiana
- Maine
- Maryland
- Massachusetts
- Michigan
- Minnesota
- Mississippi
- Missouri
- Montana
- Nebraska
- Nevada
- New Hampshire
- New Jersey
- New Mexico
- New York
- North Carolina
- North Dakota
- Ohio
- Oklahoma
- Oregon
- Pennsylvania
- Rhode Island
- South Carolina
- South Dakota
- Tennessee
- Texas
- Utah
- Vermont
- Virginia
- Washington
- West Virginia
- Wisconsin
- Wyoming
Data on state and county populations by Hispanic origin are available for download at this site in the form of Excel files. Each file contains the total, non-Hispanic and Hispanic populations for 2010 and 2000 in each state and the counties within that state. Changes in the population from 2000 to 2010 are also shown for each group. The Census 2010 population counts are tabulated from the P.L. 94-171 Summary Files. Population data for 2000 are the April 1, 2000 base for the vintage 2009 county population estimates, the latest available. Those may differ slightly from the Census 2000 counts because of post-enumeration corrections and boundary changes.
Select a state to view or download county population data.
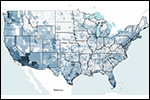
Population Distribution of Hispanic Origin Groups by County, 2010
 A map showing the distribution of all Hispanics and the six largest Hispanic origin groups in the U.S., by county.


