*Visit the most recent data on U.S. immigrants.
Characteristics of the U.S. foreign-born population: 2016
[callout align=”alignright”]Try our email course on U.S. immigration
 Learn about immigration through five short lessons delivered to your inbox every other day.
Sign up now!
[/callout]
There were a record 43.7 million immigrants living in the U.S. in 2016, making up 13.5% of the nation’s population. This represents a more than fourfold increase since 1960, when only 9.7 million immigrants lived in the U.S., accounting for just 5.4% of the total U.S. population. Click on the expand buttons below the summary tables to see detailed tables for each.
To find more context on the figures below, visit the blog posts “Key findings about U.S. immigrants” and “Education levels of U.S. immigrants are on the rise,” and for a downloadable version of the tables below, see the PDF and the Excel workbook. For a profile of the Hispanic population in the United States, click here.
Population, region of birth, nativity and years in the U.S.
| Population (#) | 43,681,654 |
| Born in Mexico | 26.5% |
| Citizen | 48.7% |


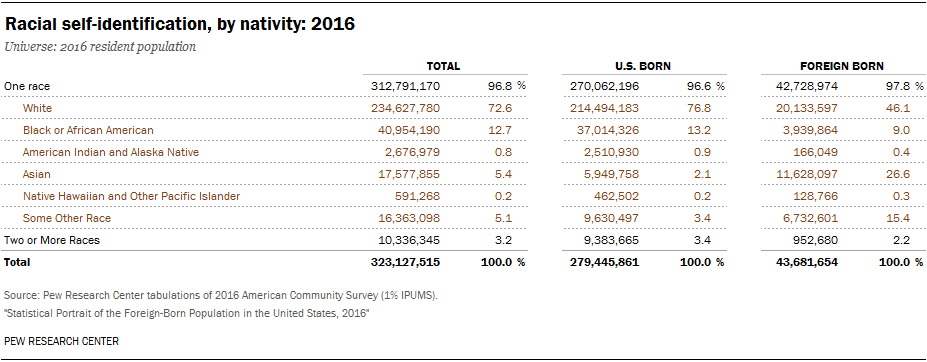
Race
| White alone, not Hispanic | 18.1% |

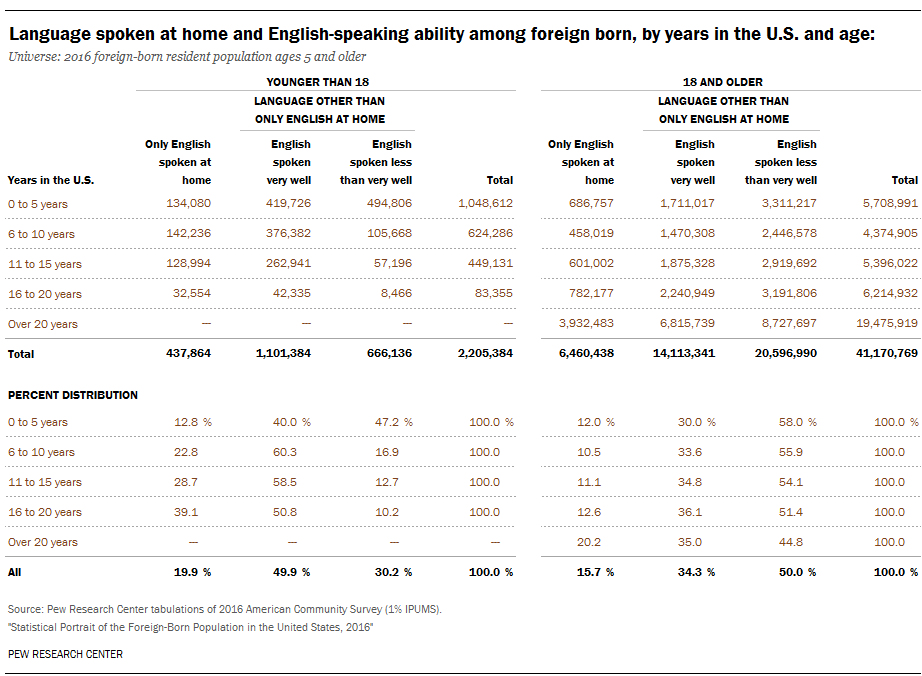
Language use
| Speaking English at least very well (ages 5 and older) | 51.0% |

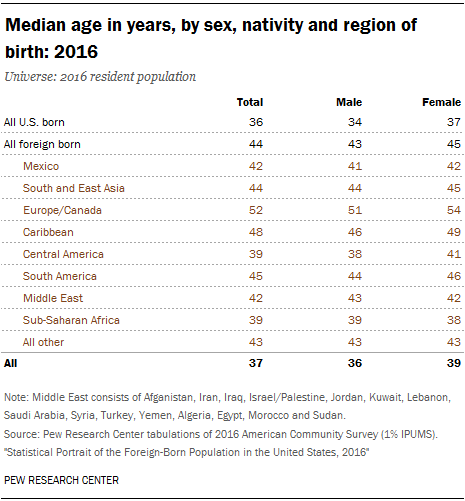
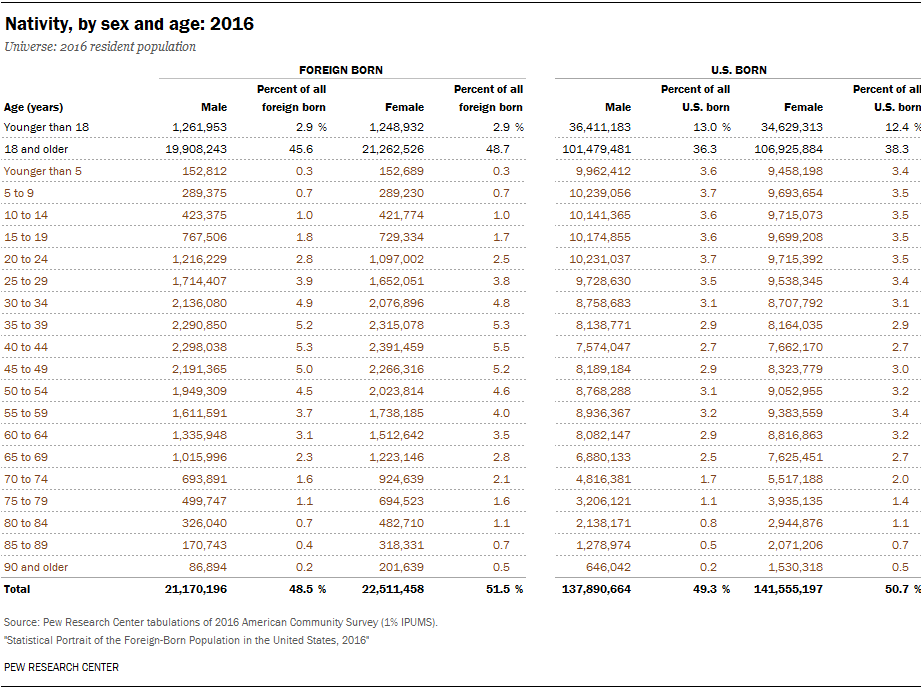
Age and gender
| Median age (in years) | 44 |
| Female | 51.5% |


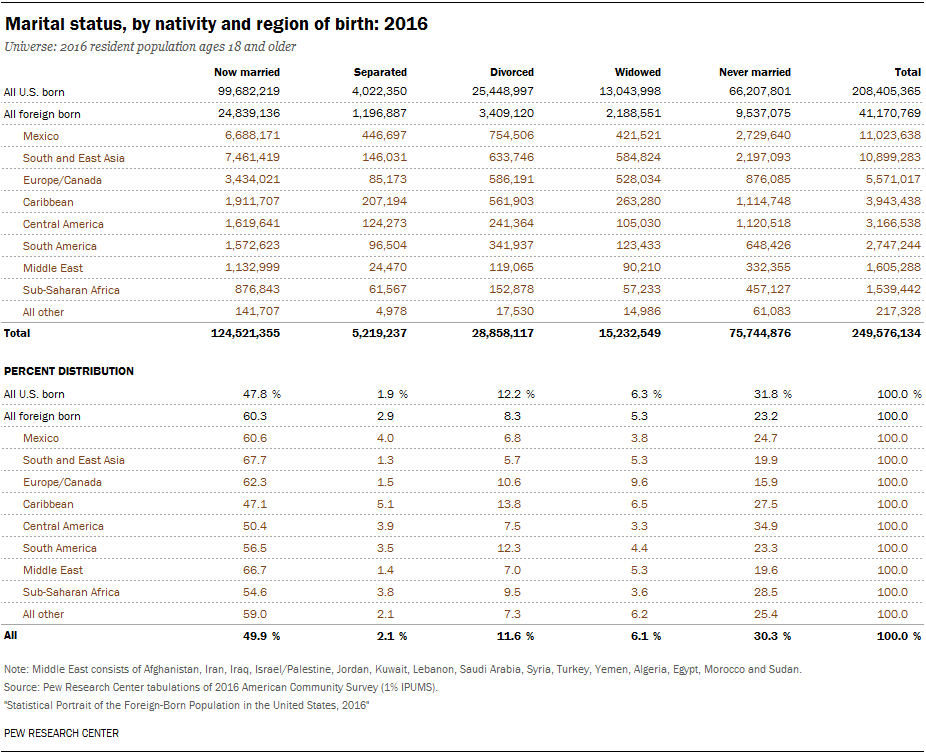
Marital status and fertility
| Married (ages 18 and older) | 60.3% |
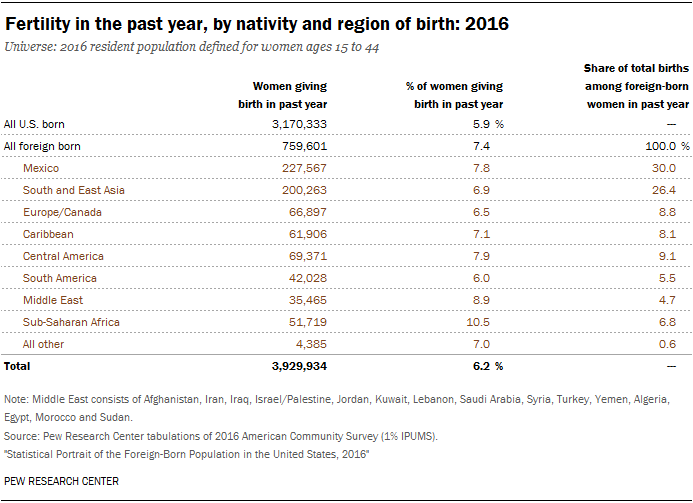
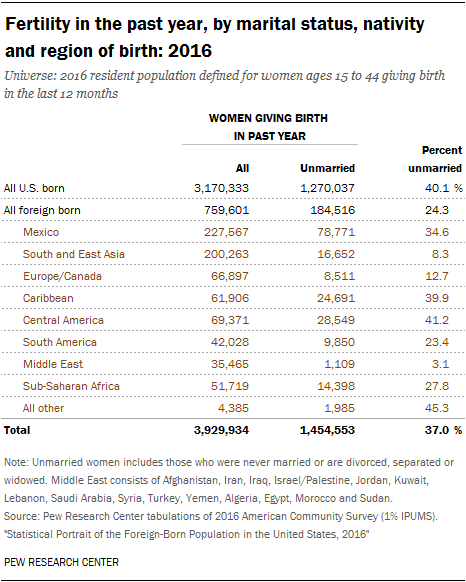
| Women ages 15-44 giving birth in past year | 7.4% |
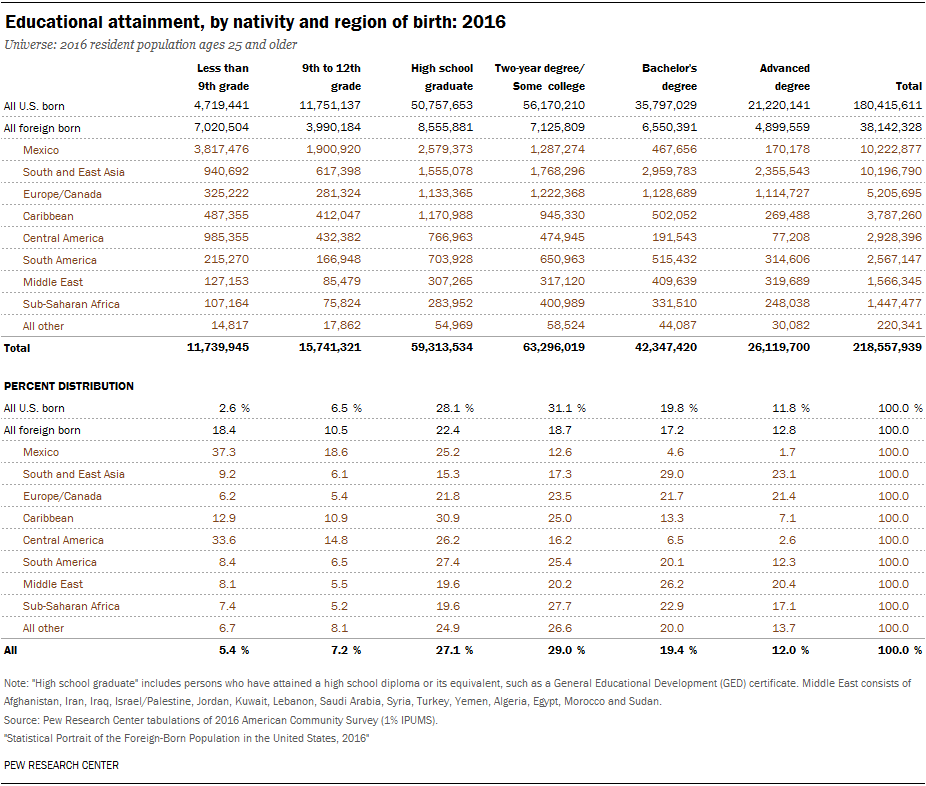
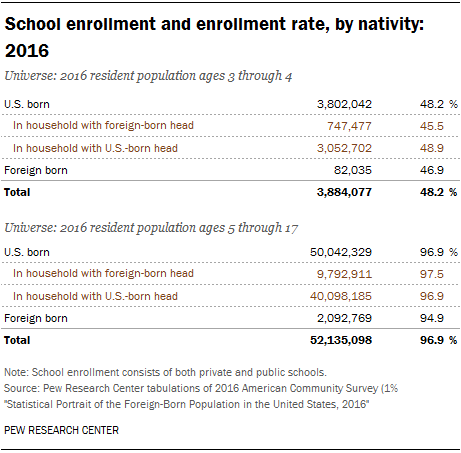
Educational attainment and enrollment (highest degree completed, ages 25 and older)
| High school graduate or less | 51.3% |
| Two-year degree/Some college | 18.7% |
| Bachelor’s degree or more | 30.0% |
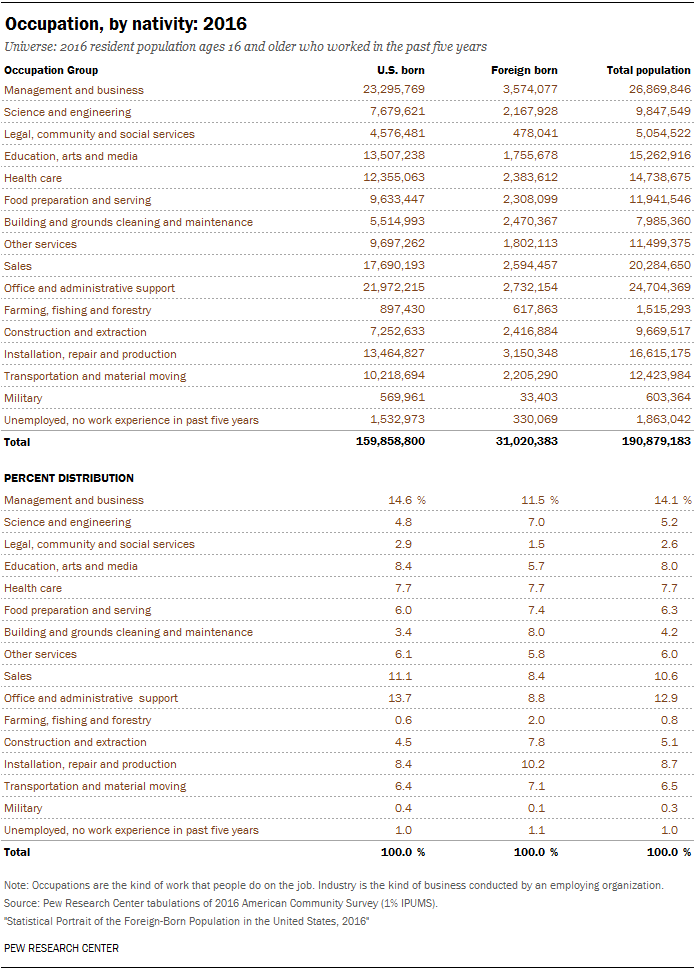
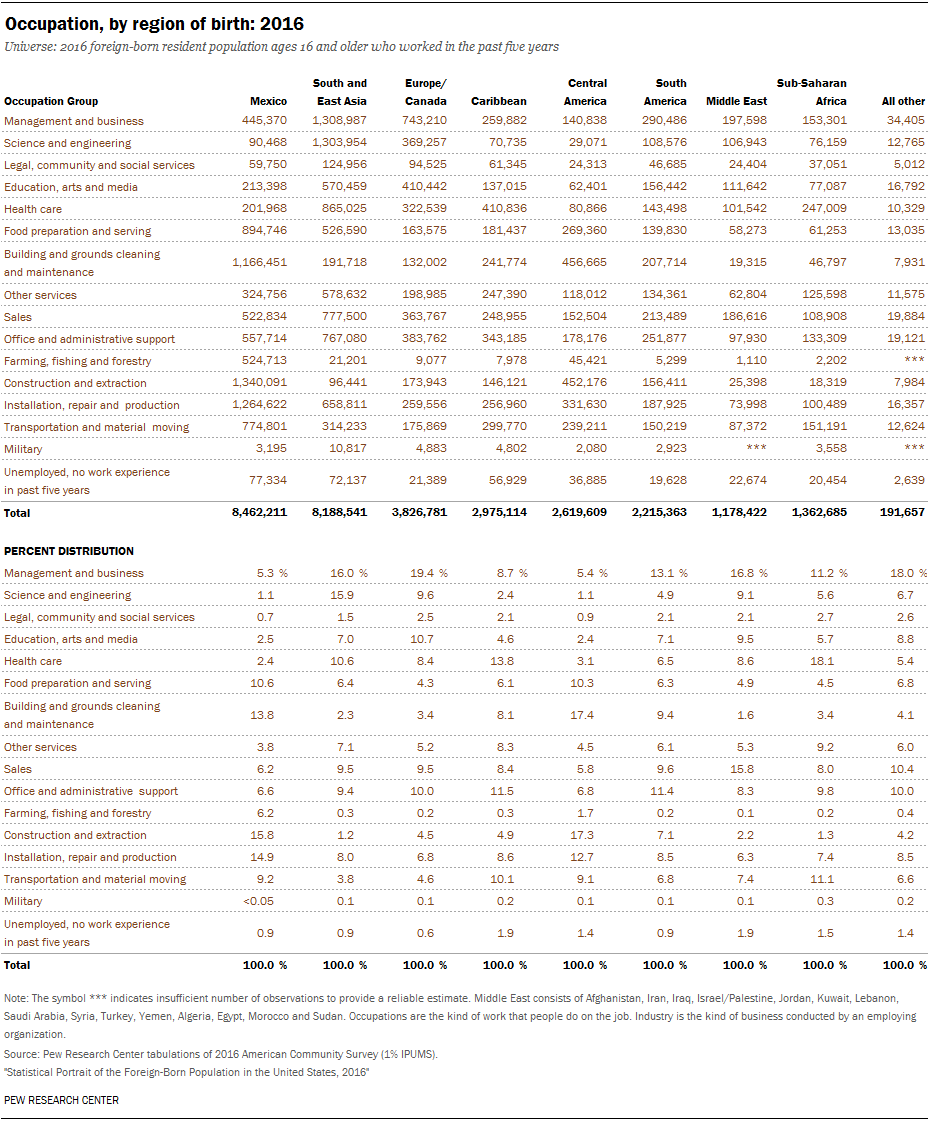
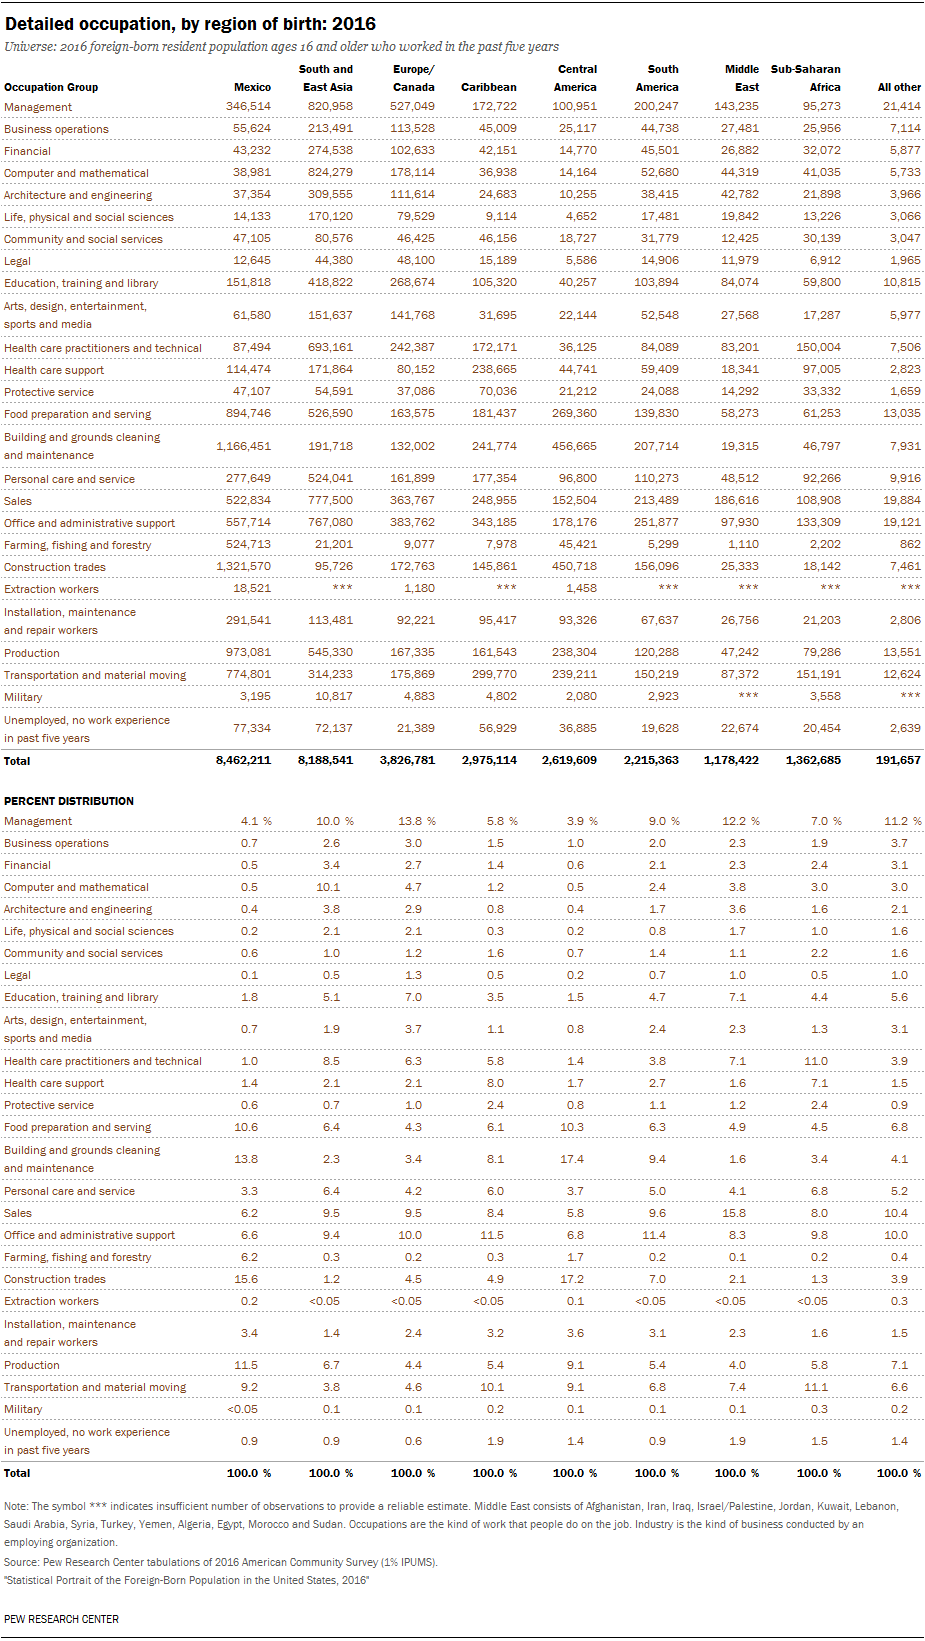
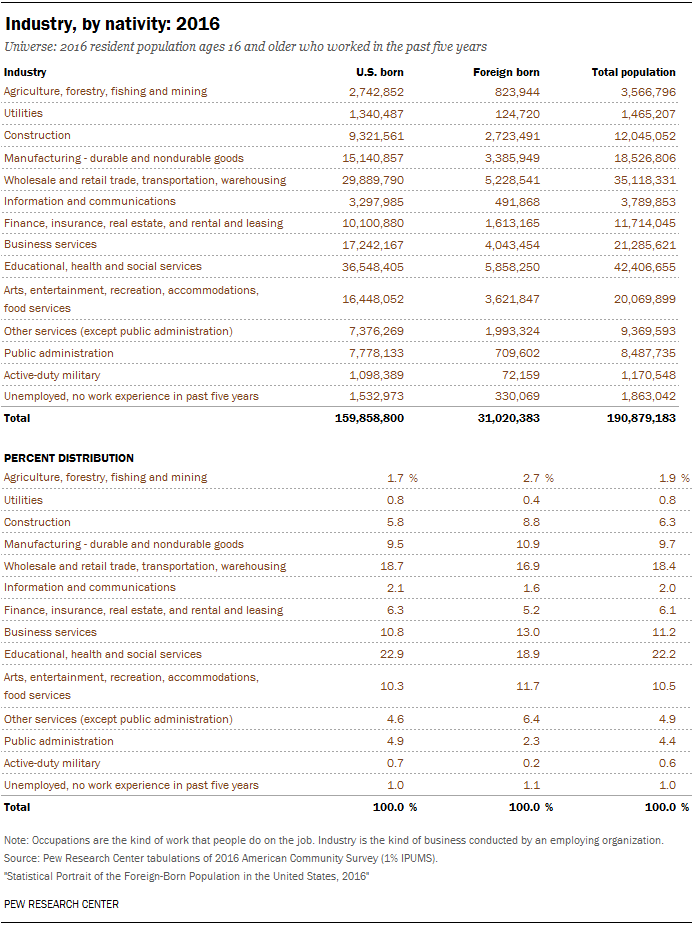
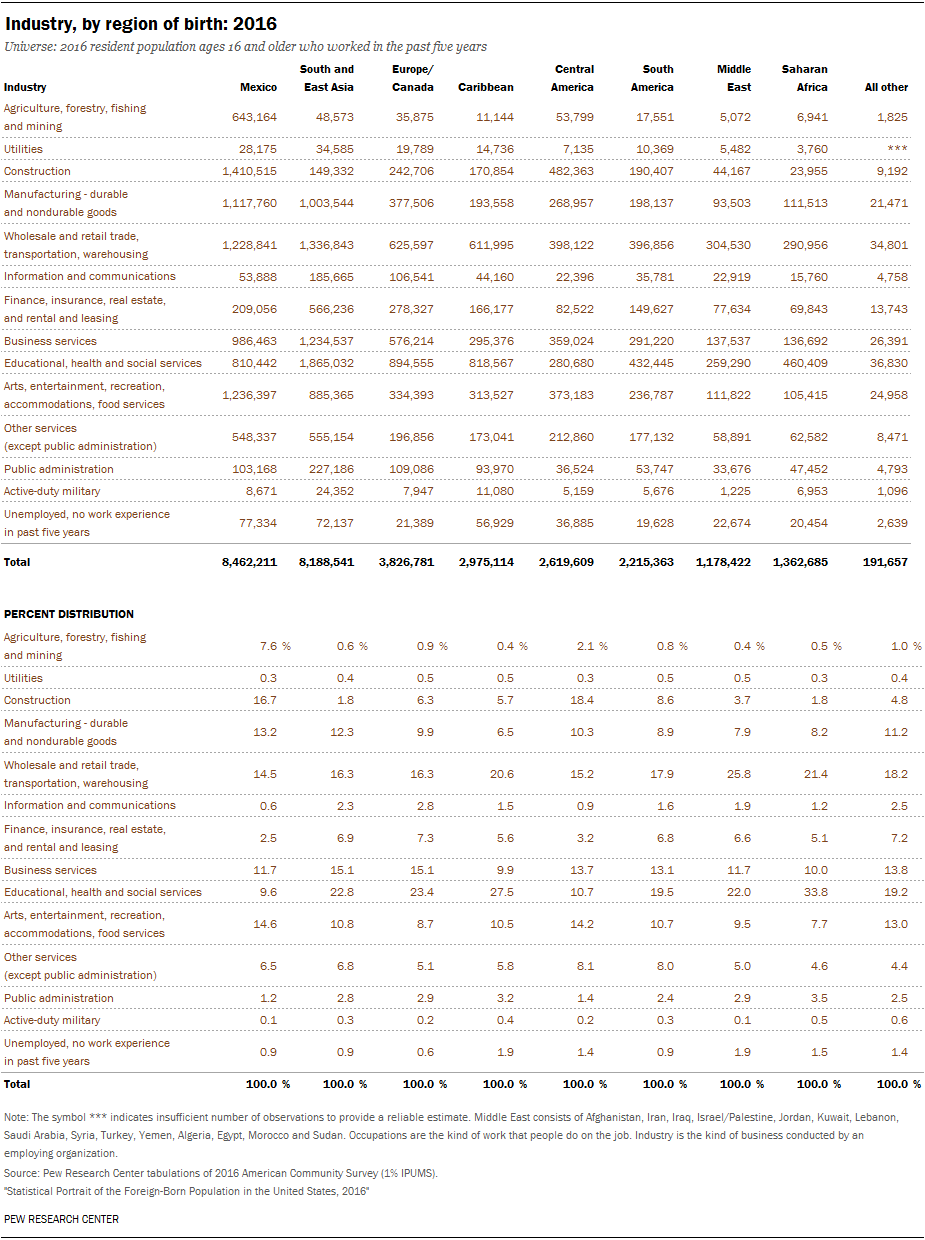
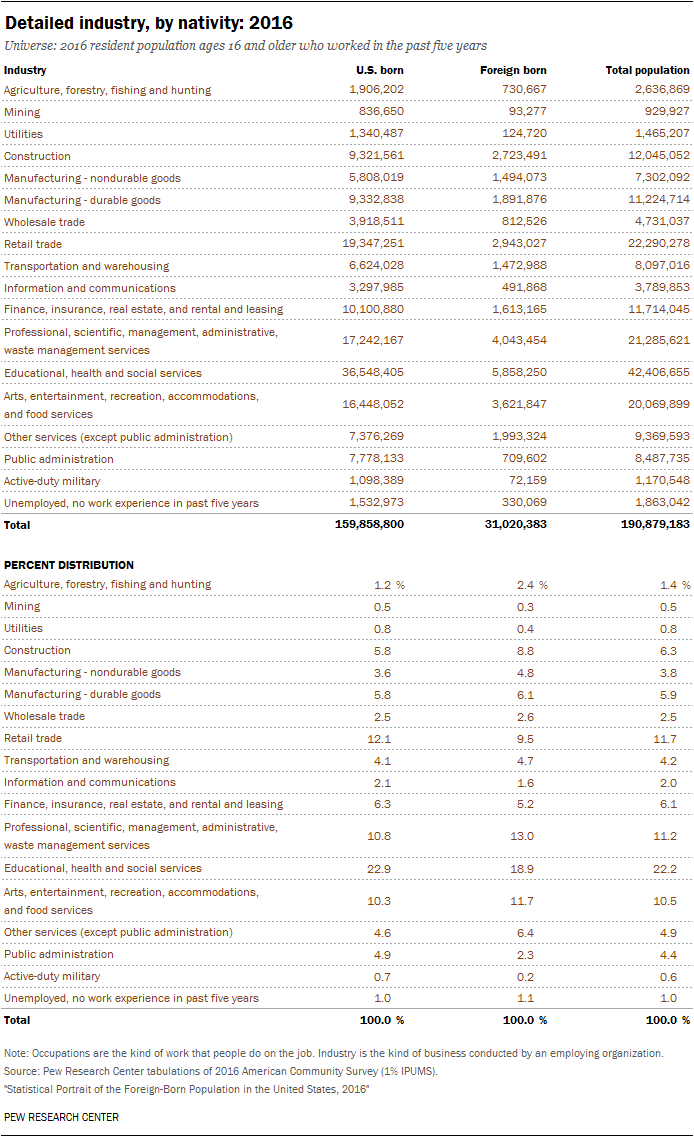
Work (ages 16 and older)
| In labor force (among civilian population) | 66.1% |


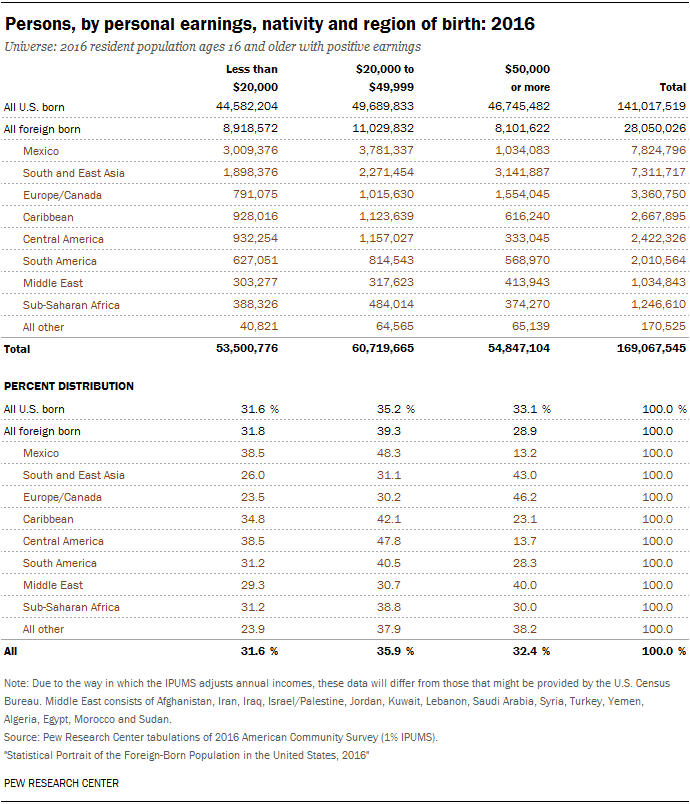
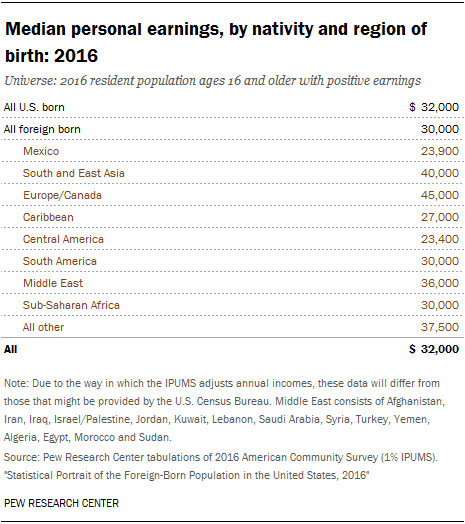
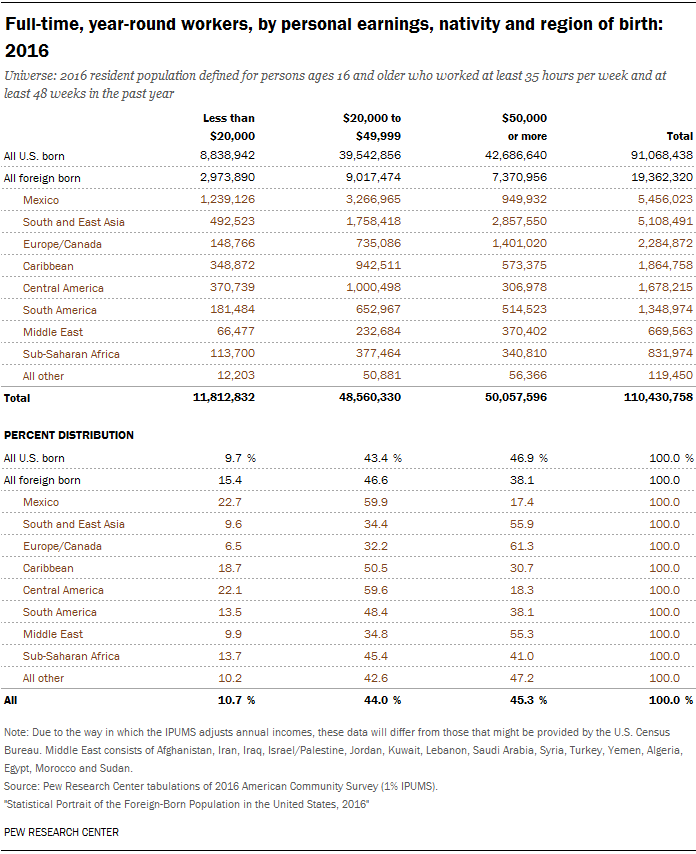
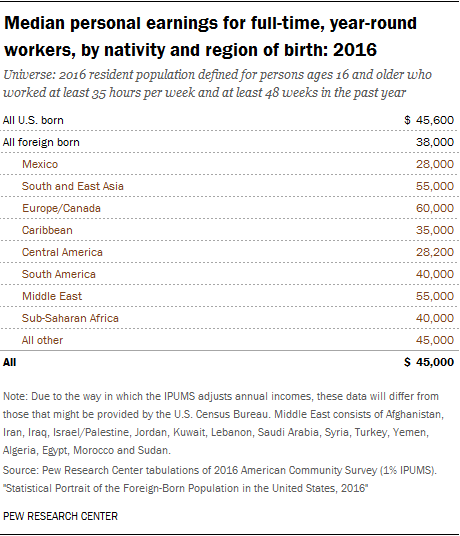
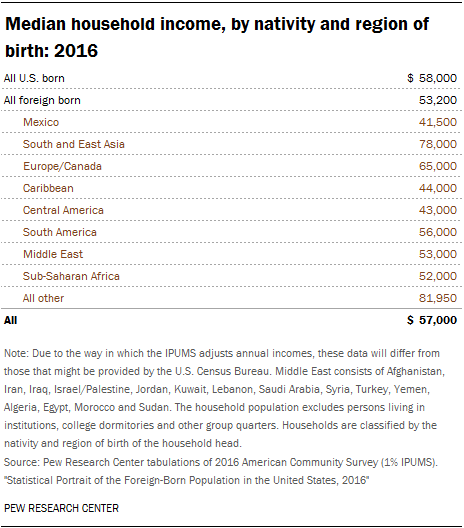
Earnings and income (ages 16 and older)
| Median annual personal earnings (in 2016 dollars, among those with earnings) | $30,000 |
| Median annual household income (in 2016 dollars) | $53,200 |
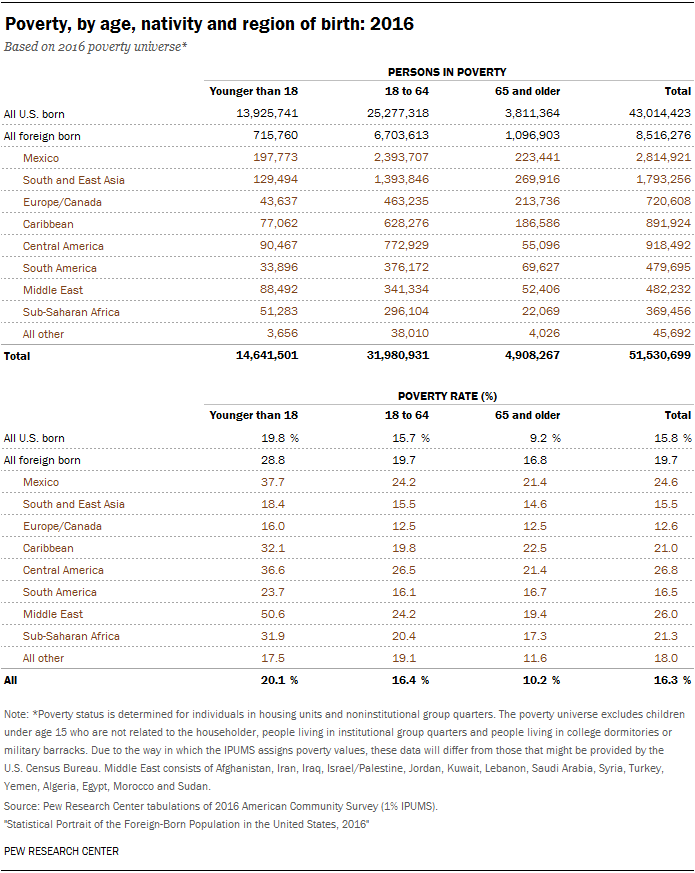
Poverty and health insurance
| Living in poverty | 19.7% |
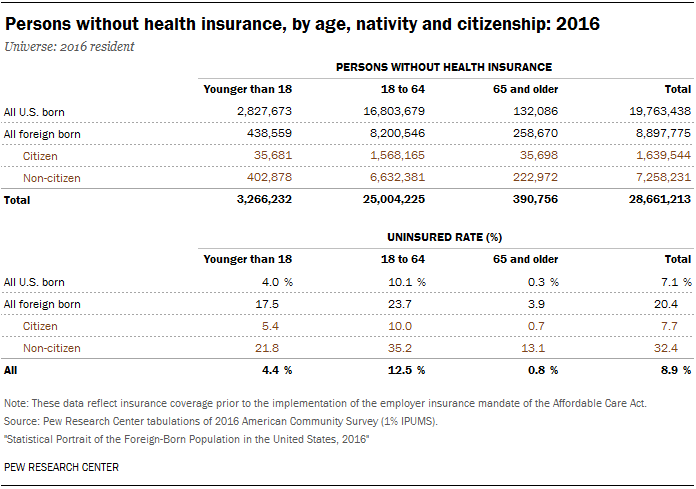
| Uninsured | 20.4% |

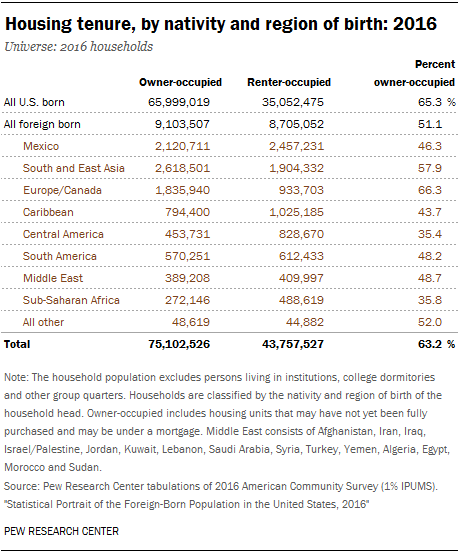
Homeownership and household characteristics
| In family households | 82.3% |


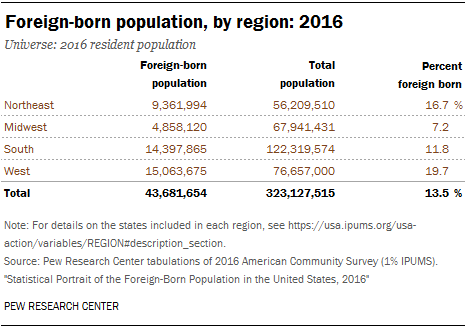
Region and top five states of residence
| West | 34.5% |
| California | 24.5% |
| South | 33.0% |
| Texas | 10.8% |
| Florida | 9.7% |
| Northeast | 21.4% |
| New York | 10.4% |
| New Jersey | 4.6% |
| Midwest | 11.1% |

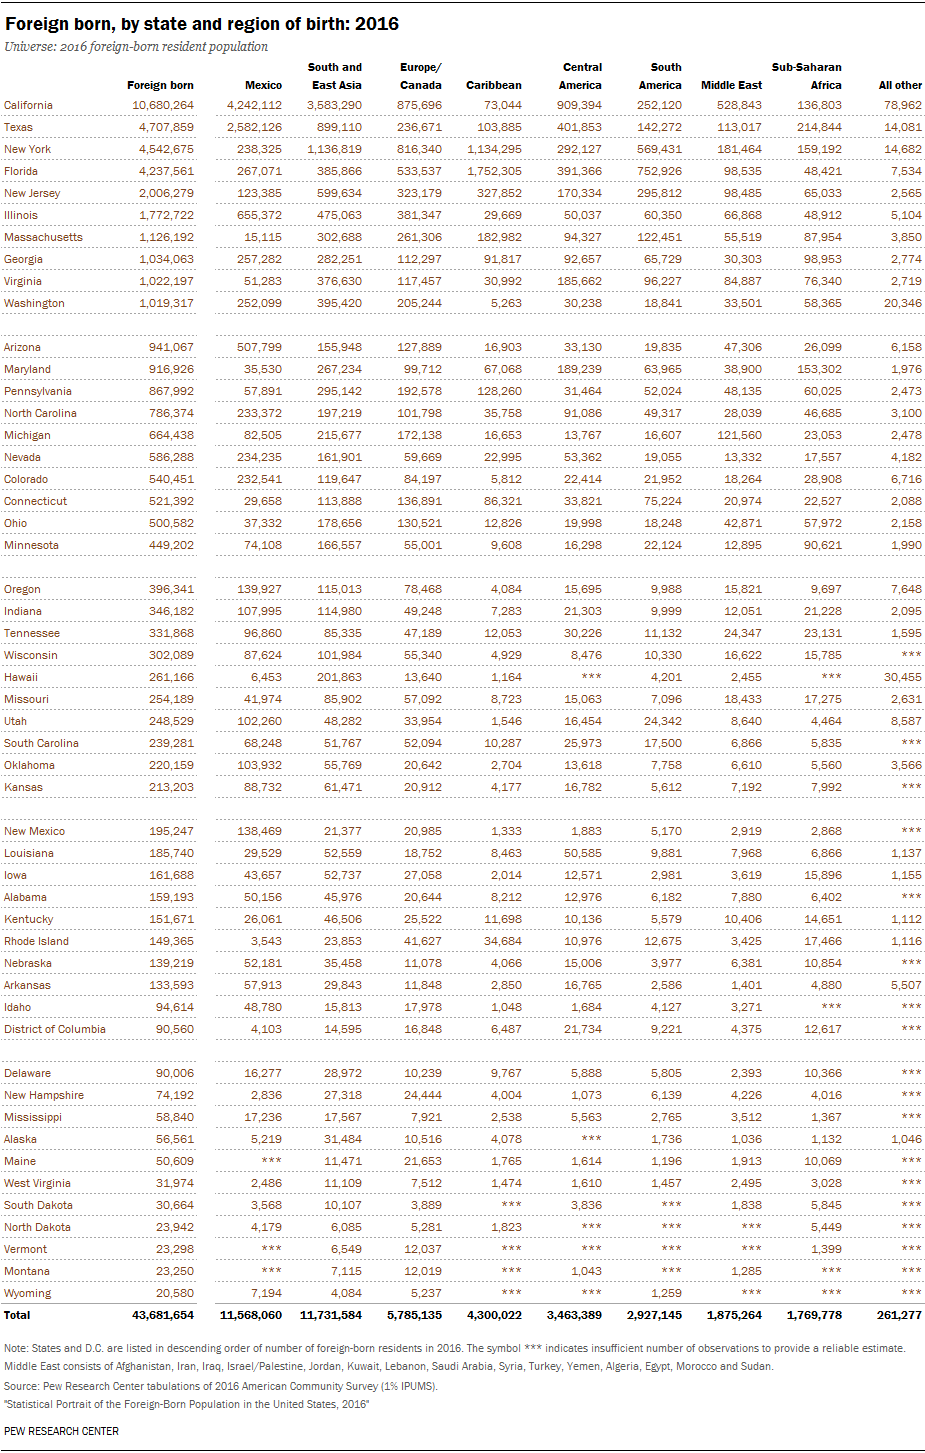
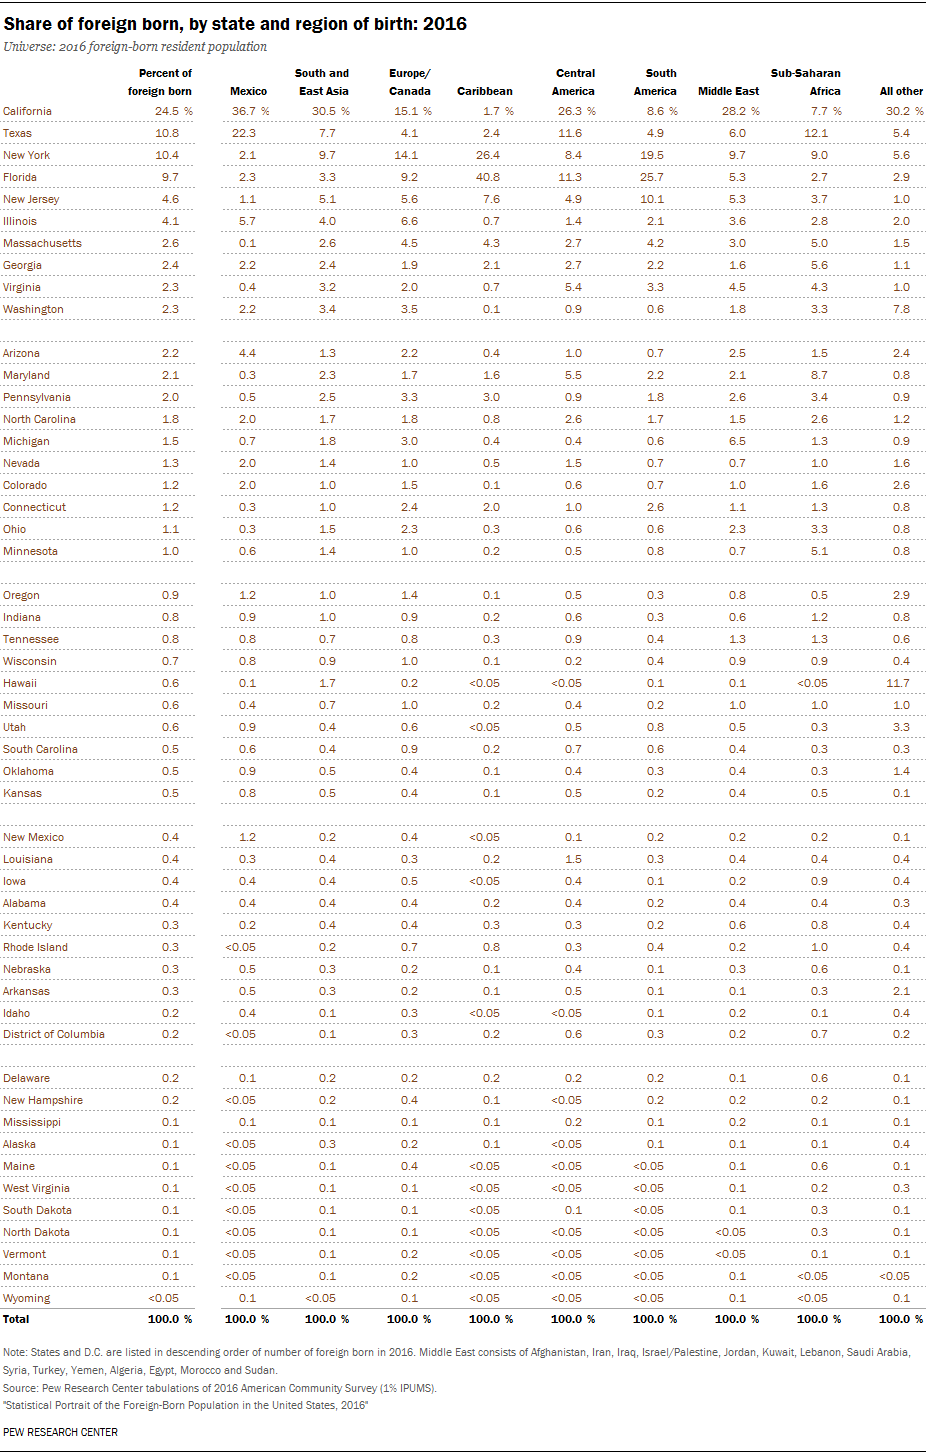
Source: Pew Research Center tabulations of 2016 American Community Survey (1% IPUMS).
“Statistical Portrait of the Foreign-Born Population in the United States, 2016”
