*Visit the most recent data on U.S. Hispanics.
Characteristics of the U.S. Hispanic population: 1980-2015
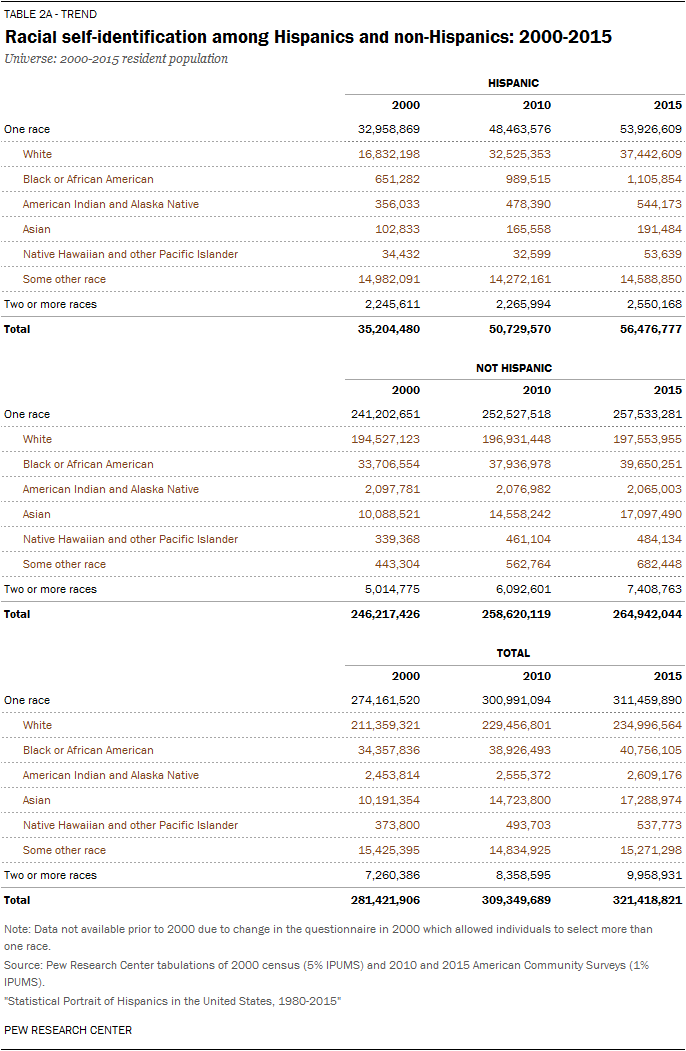
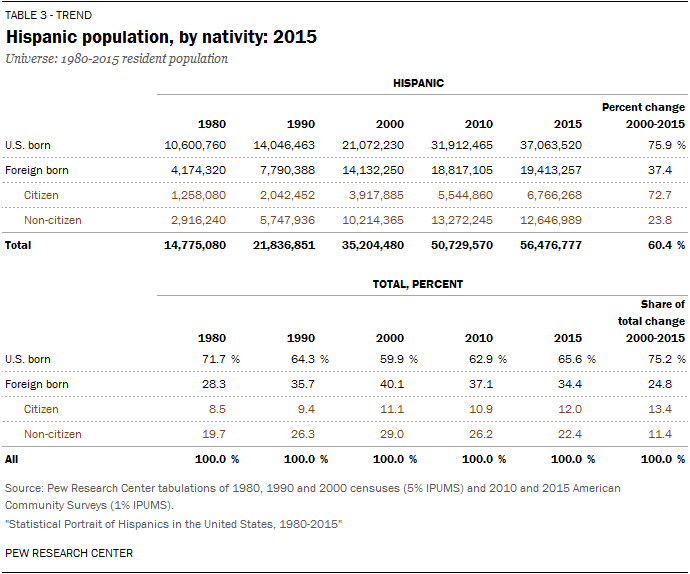
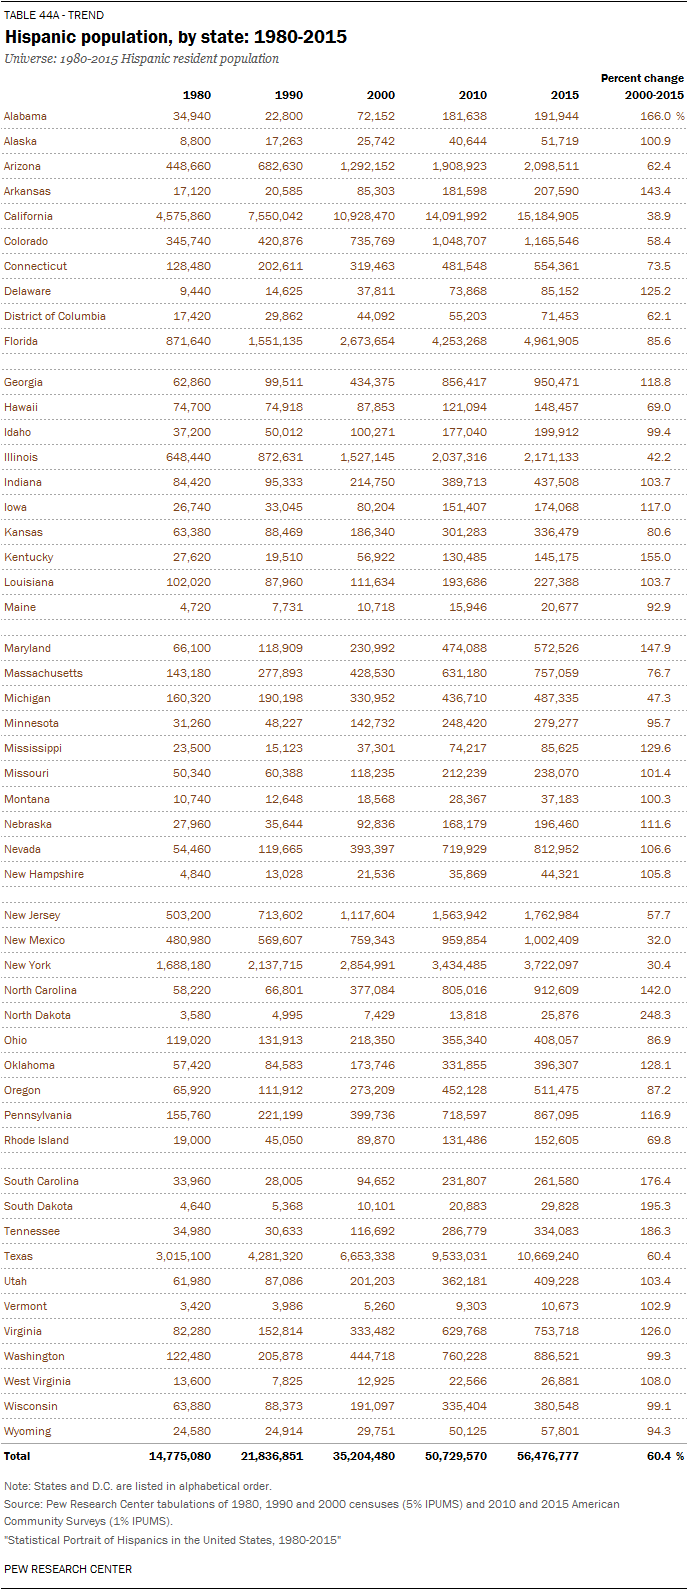
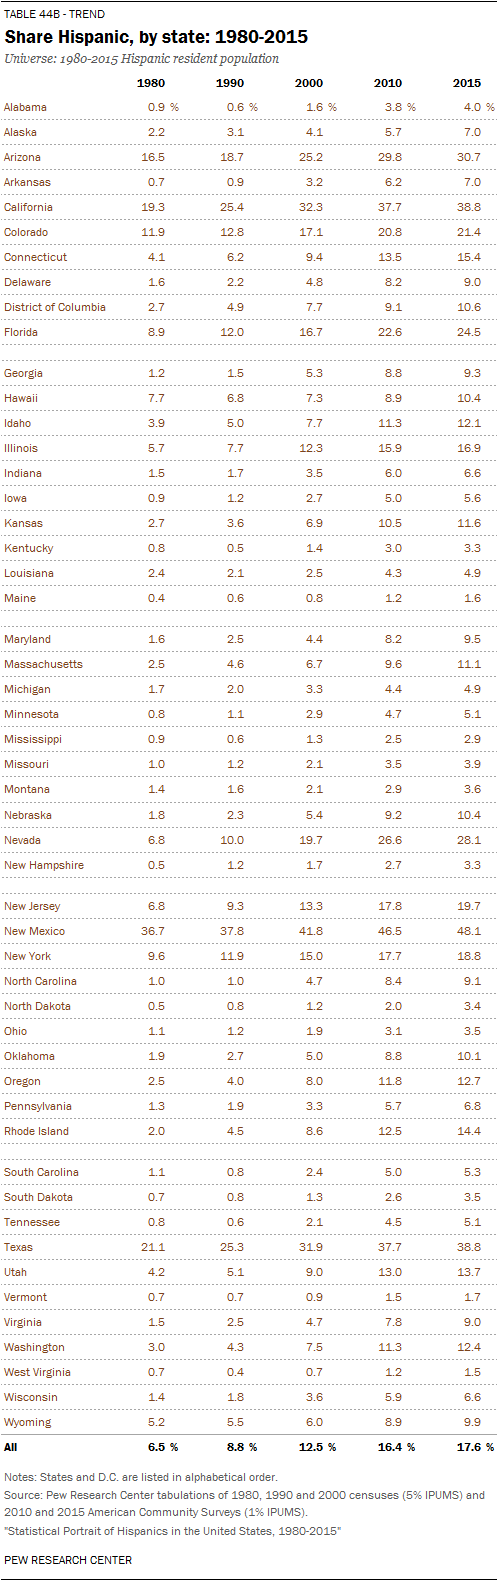
There were 56.5 million Hispanics in the United States in 2015, comprising 17.6% of the total U.S. population. In 1980, with a population of 14.8 million, Hispanics made up just 6.5% of the total U.S. population. Click on the expand buttons below the summary tables to see detailed tables for each.
Click here for a PDF of all the tables below and read the accompanying blog post, “How the U.S. Hispanic population is changing.” Download the Excel workbook.
For a profile of the foreign-born population in the United States, click here.
Population/Hispanic Origin/Language Use/Race
| 1980 | 1990 | 2000 | 2010 | 2015 | |
| Population (#) | 14,775,080 | 21,836,851 | 35,204,480 | 50,729,570 | 56,476,777 |
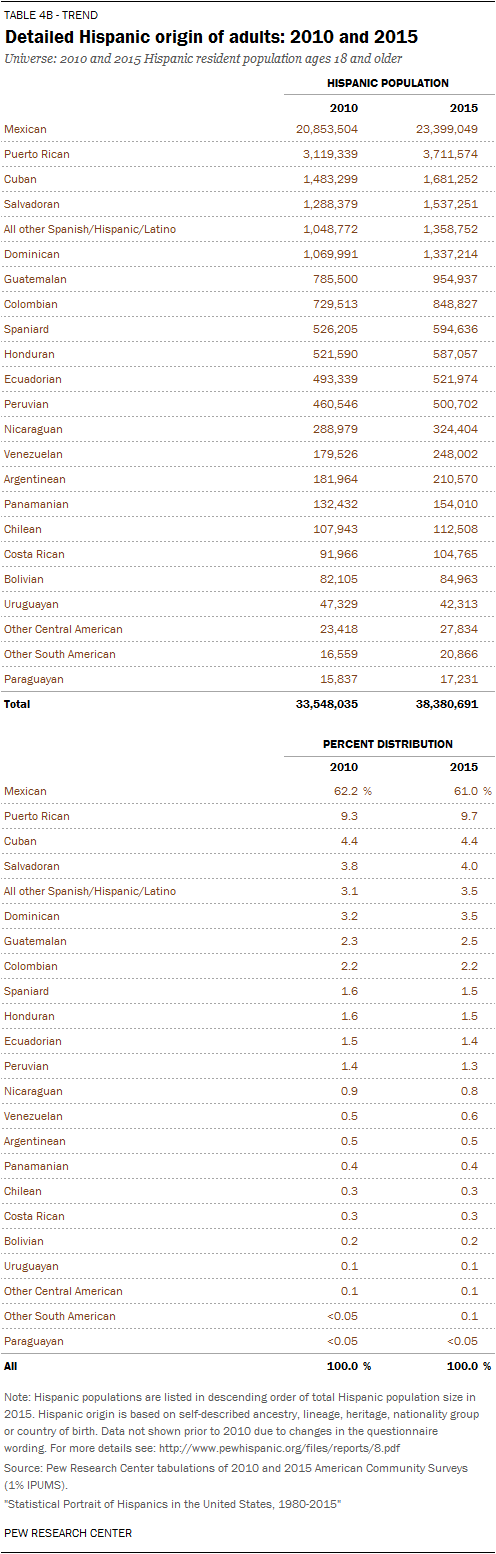
| Mexican | N/A | N/A | N/A | 64.9% | 63.3% |
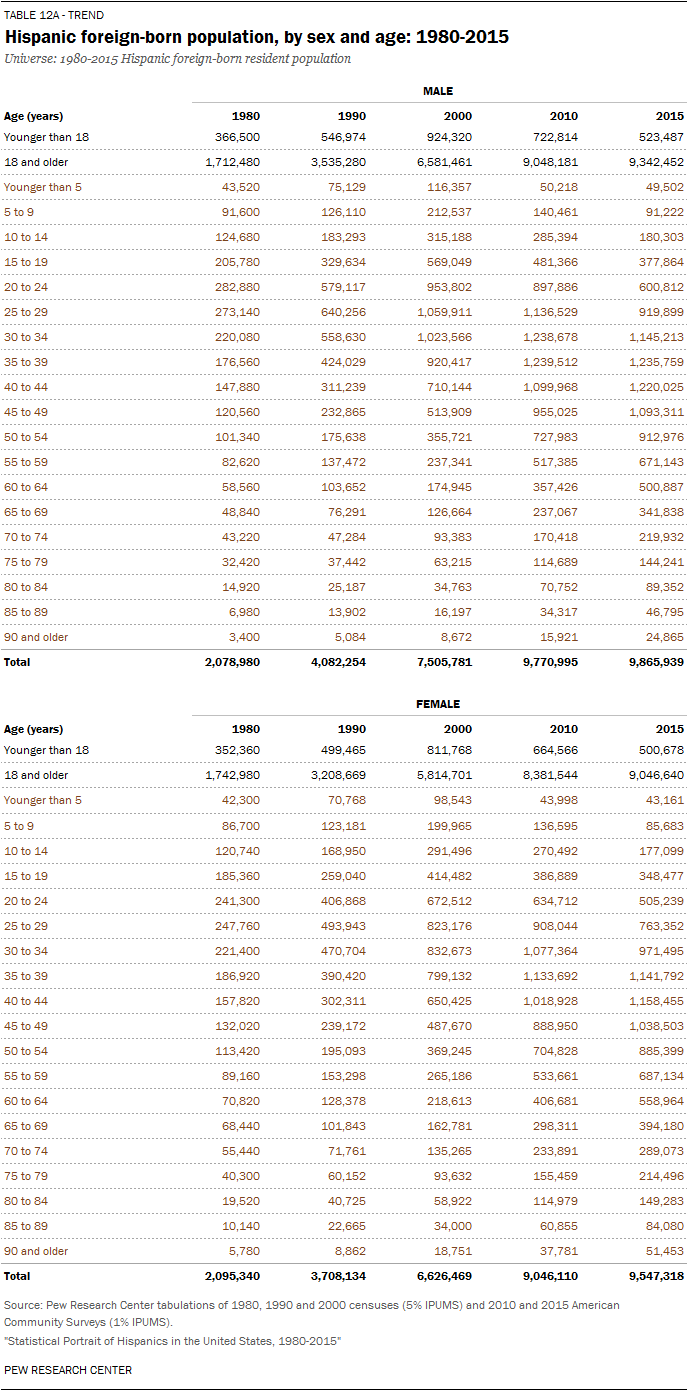
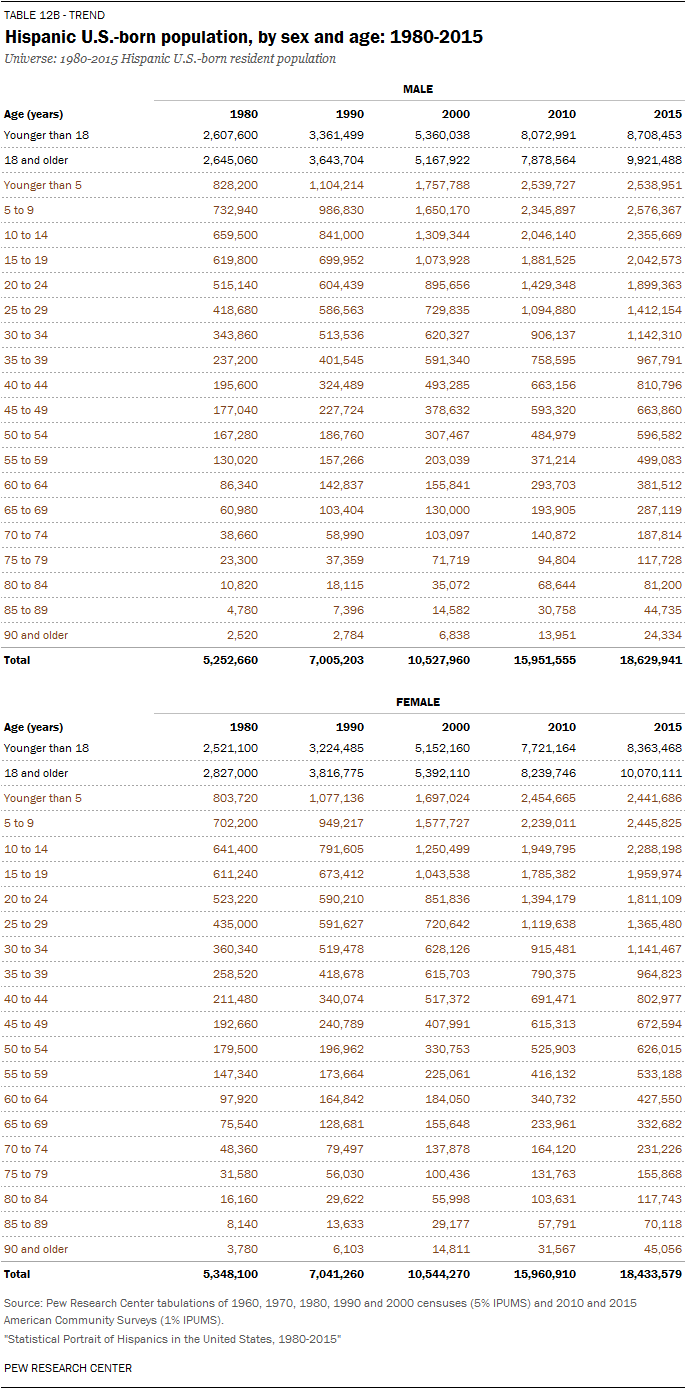
| Foreign born | 28.3% | 35.7% | 40.1% | 37.1% | 34.4% |
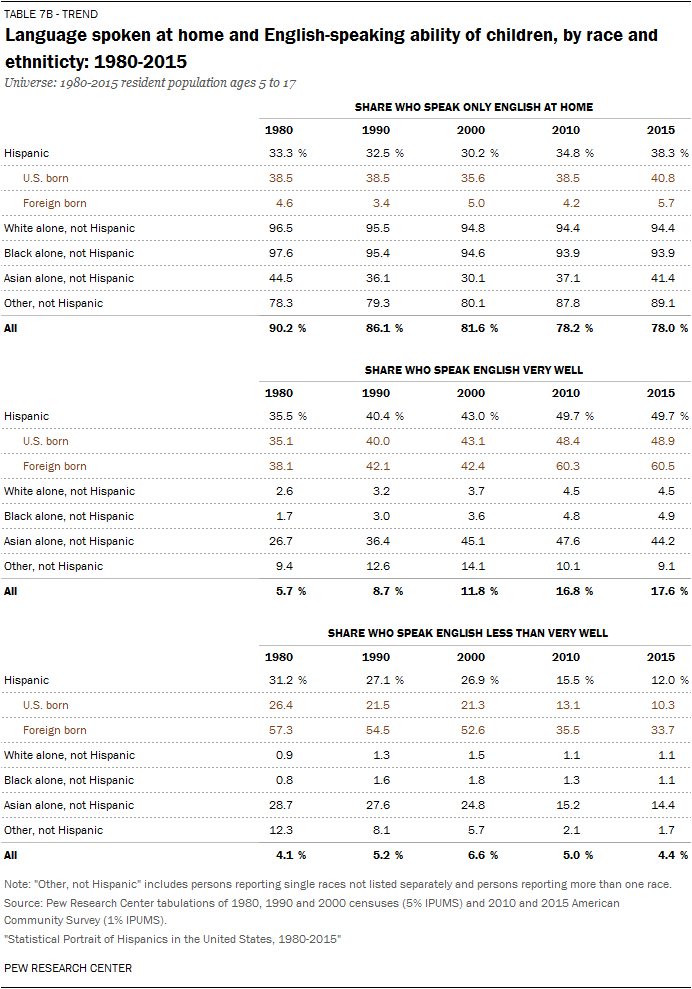
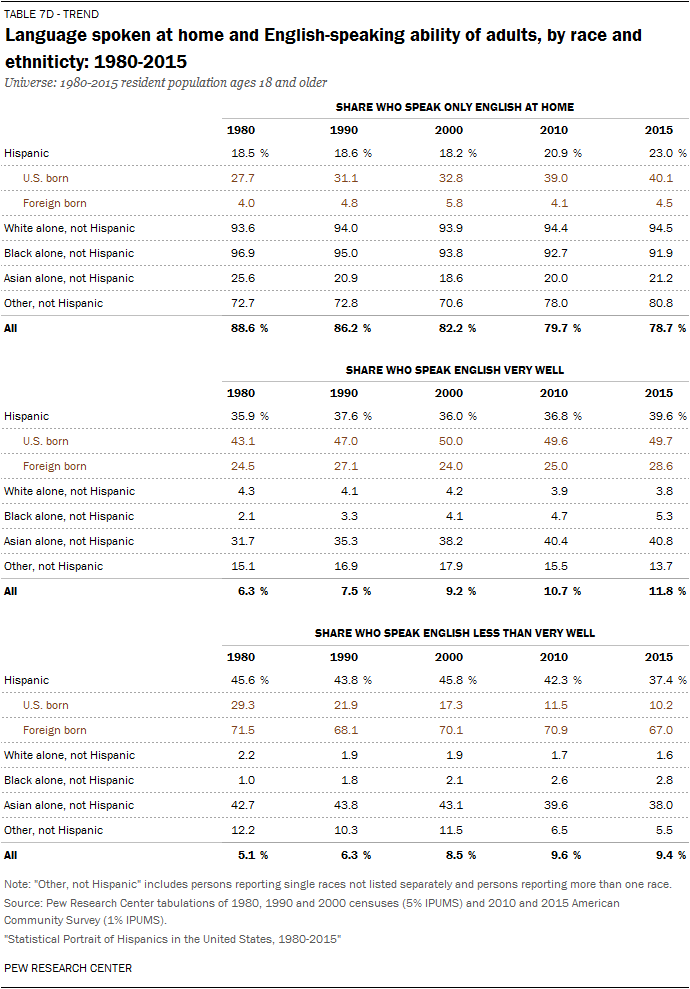
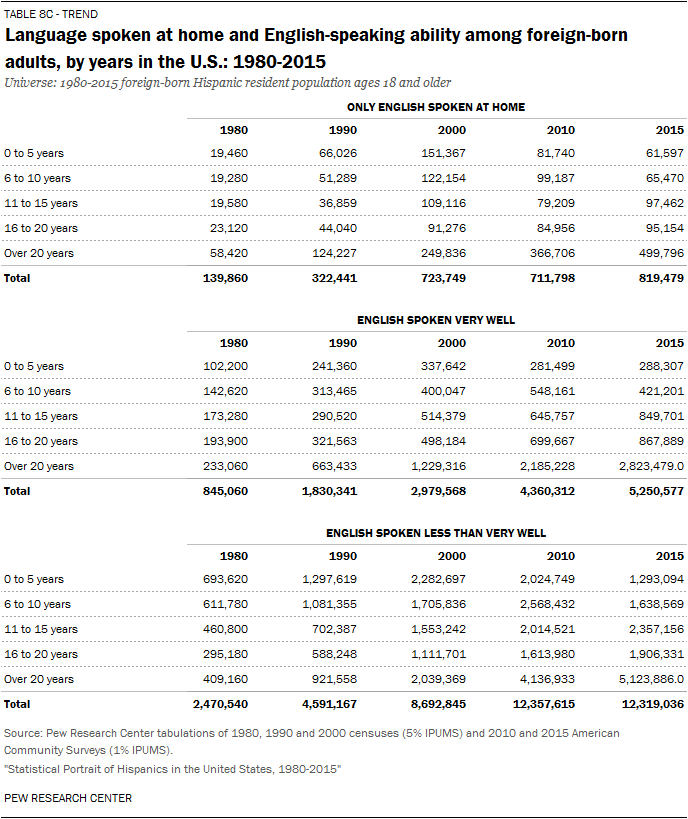
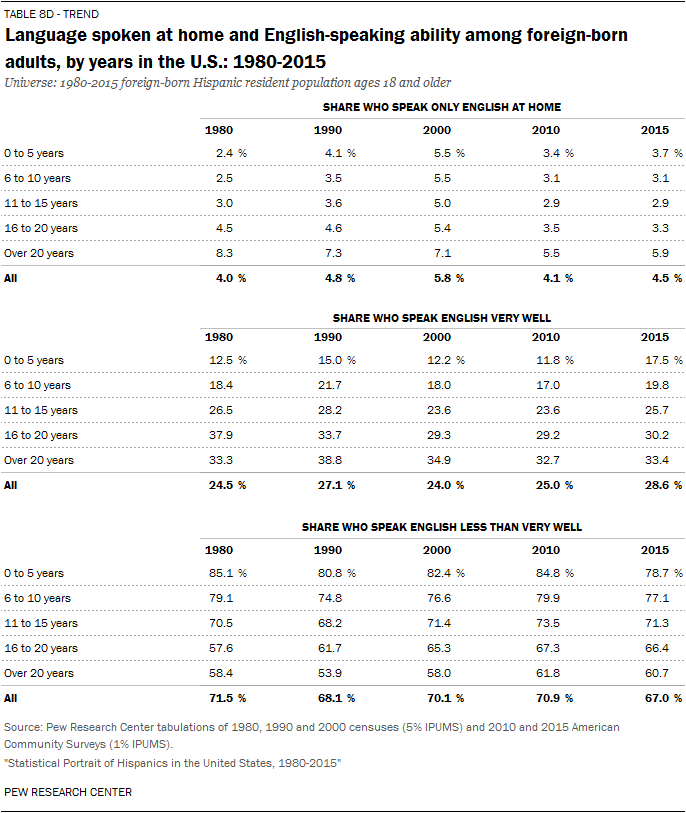
| Speaking English at least very well (ages 5 and older) | 59.0% | 60.7% | 59.3% | 64.8% | 69.0% |
| White | N/A | N/A | 47.8% | 64.1% | 66.3% |


Age/Gender/Marital Status/Fertility
| 1980 | 1990 | 2000 | 2010 | 2015 | |
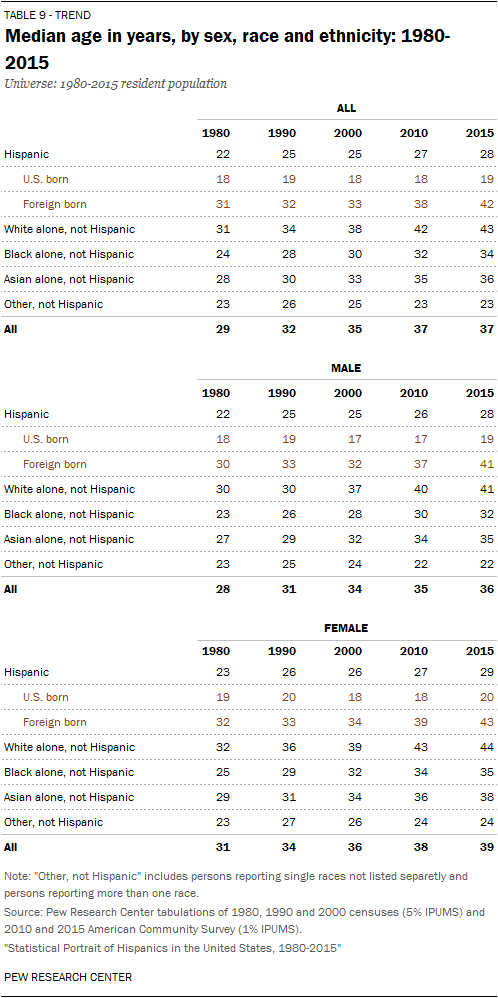
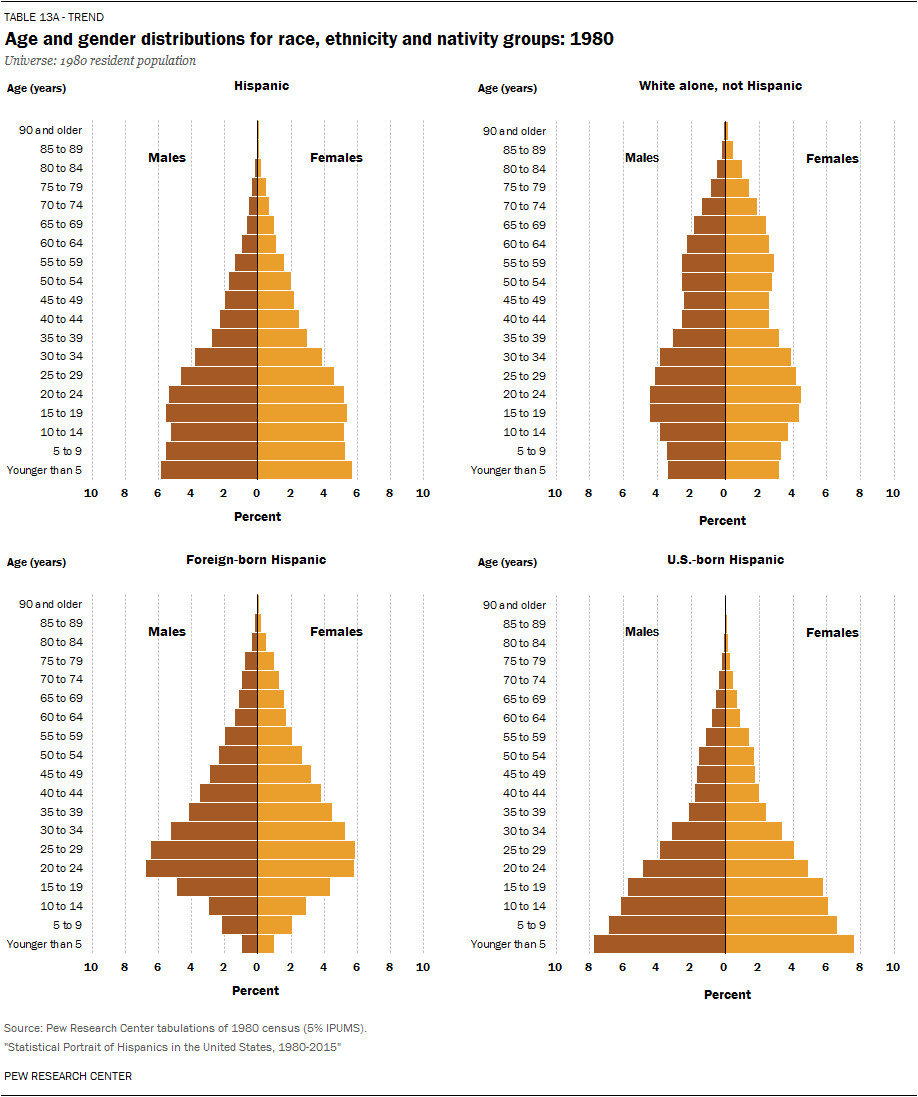
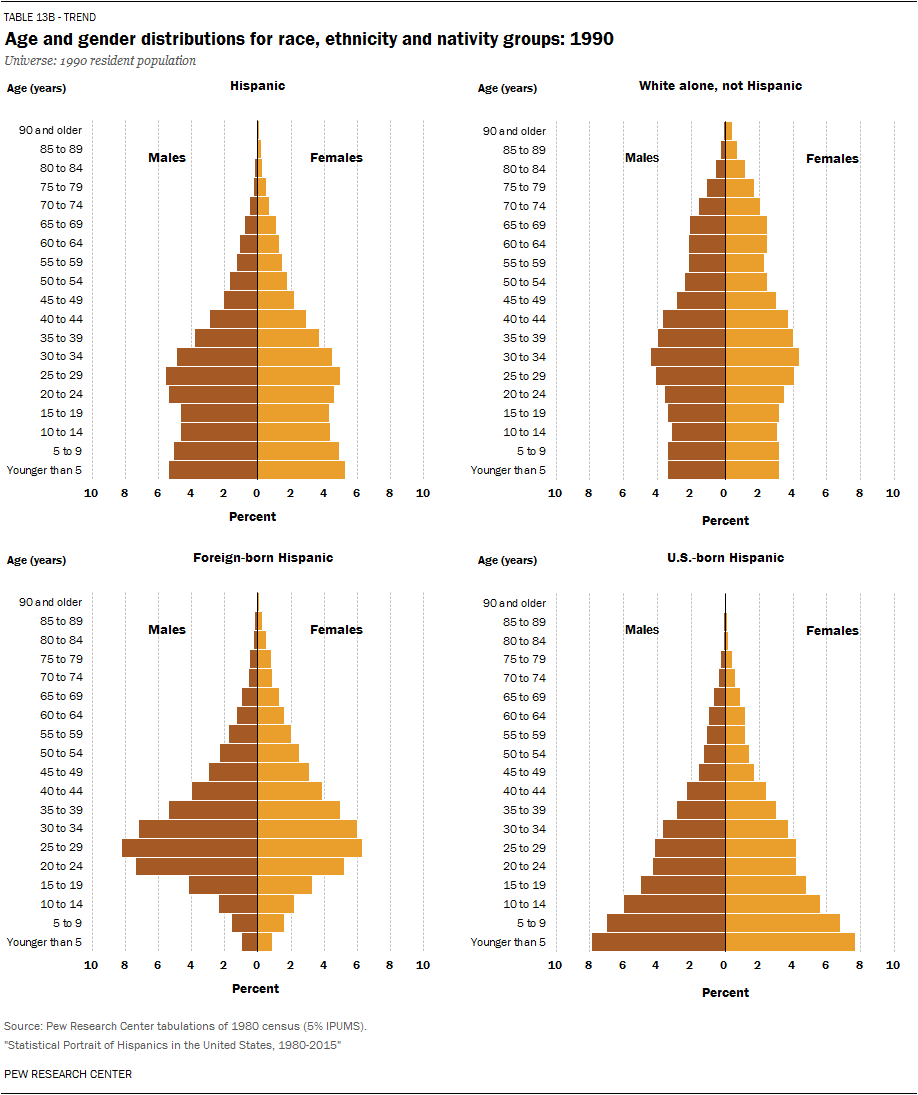
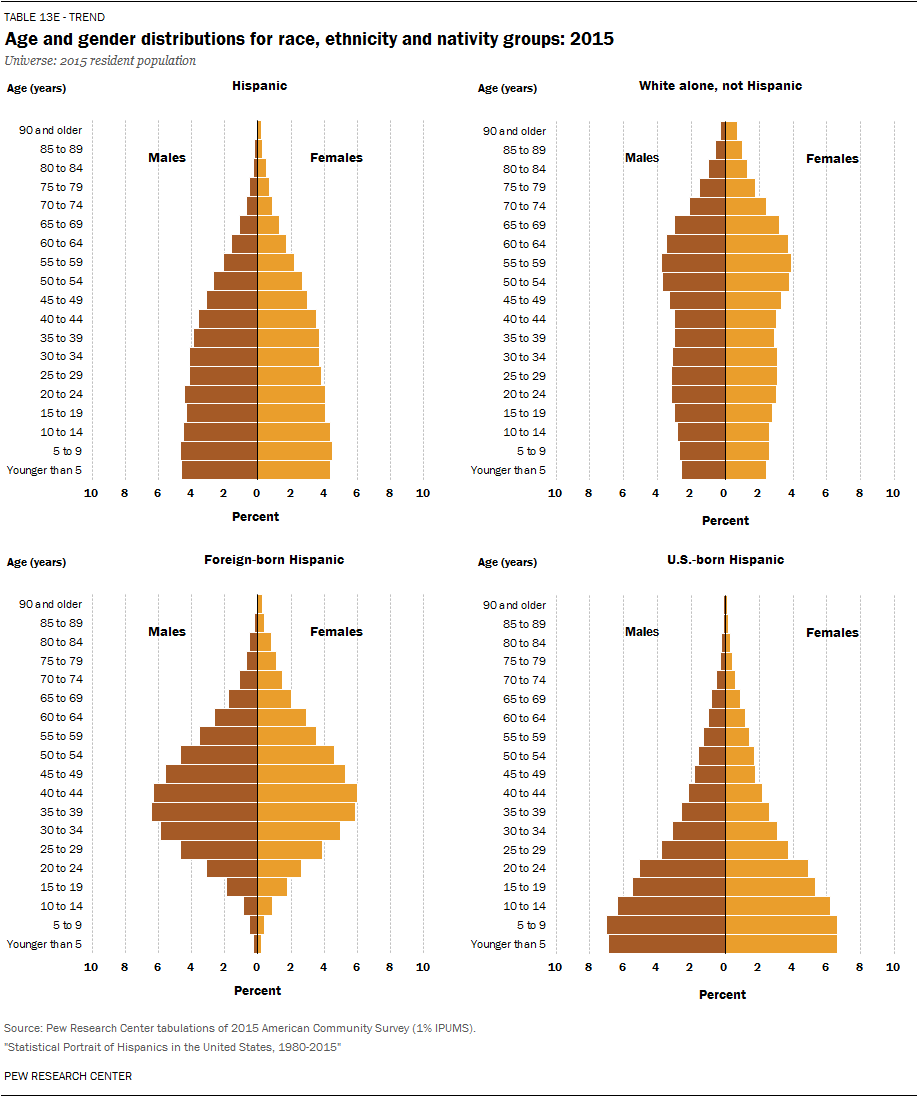
| Median age (in years) | 22 | 25 | 25 | 27 | 28 |
| Female | 50.4% | 54.9% | 55.0% | 47.8% | 45.8% |
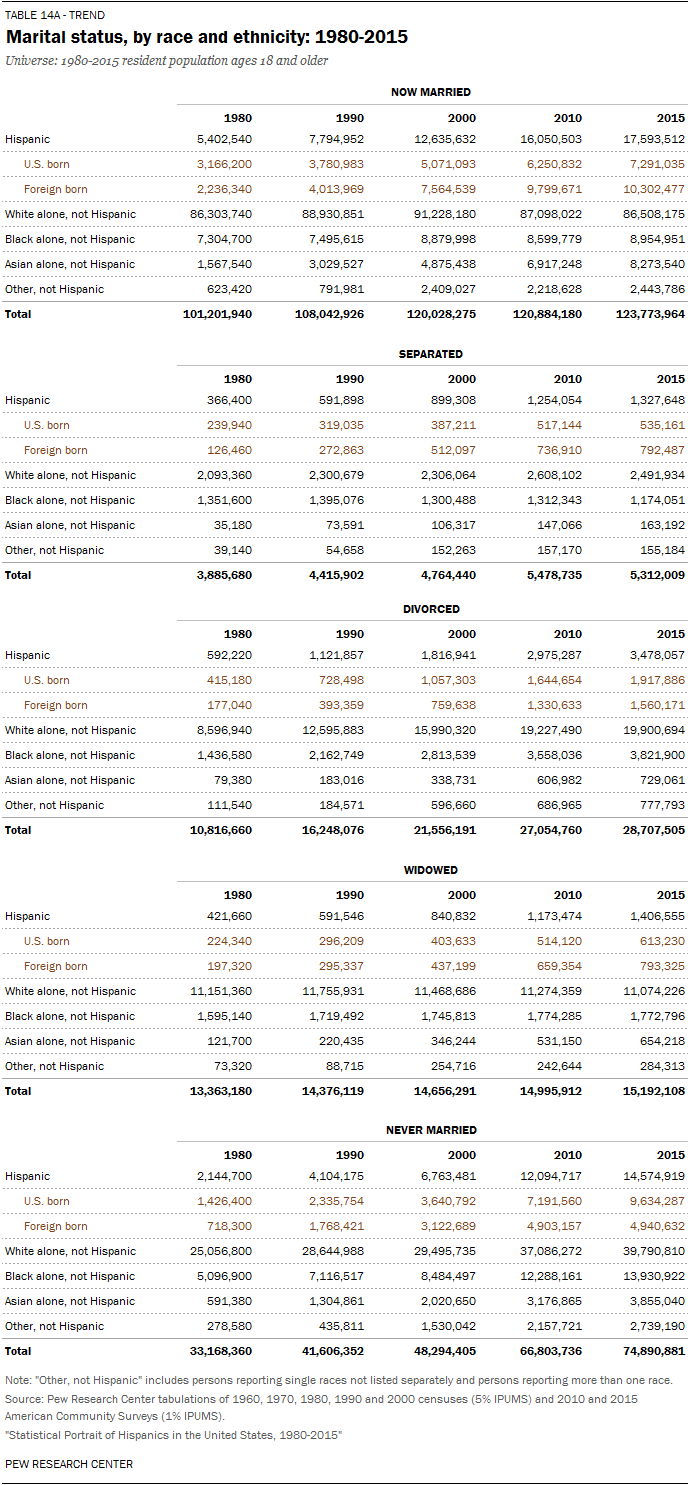
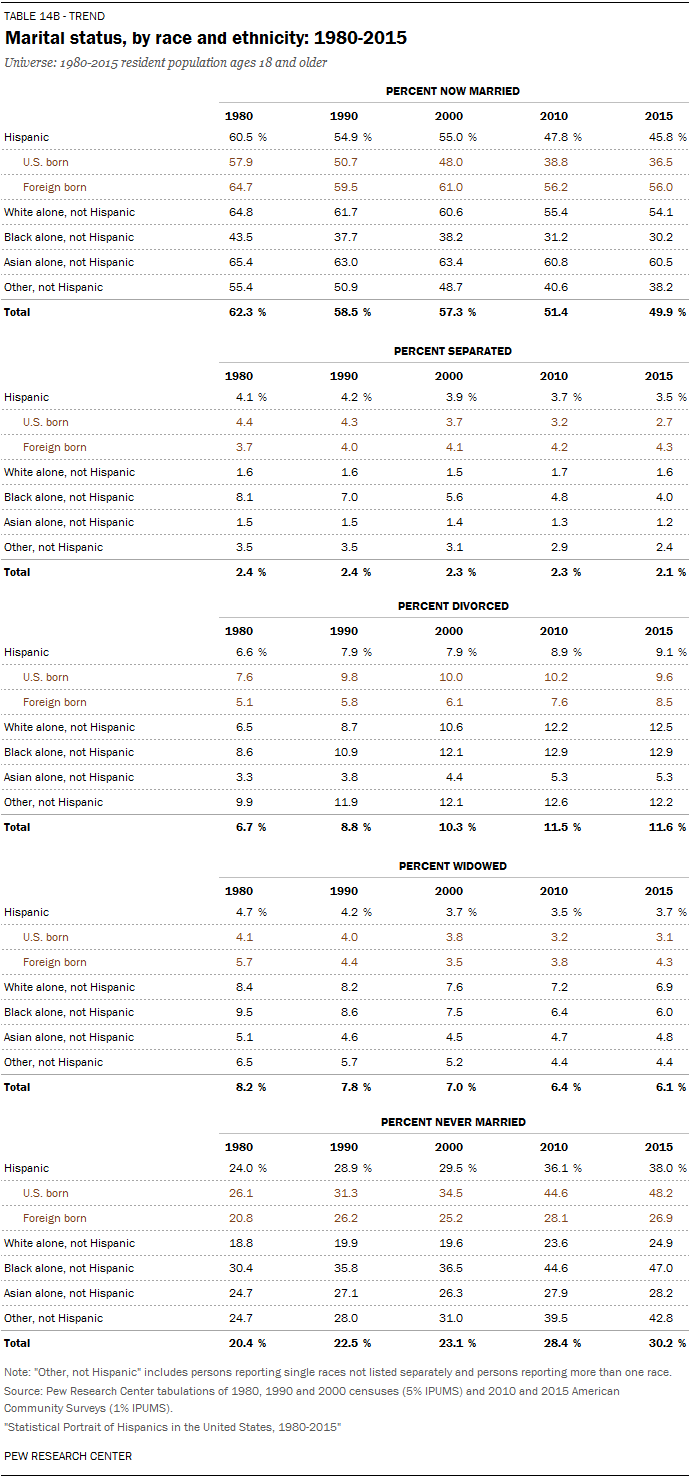
| Married (ages 18 and older) | 60.5% | 54.9% | 55.0% | 47.8% | 45.8% |
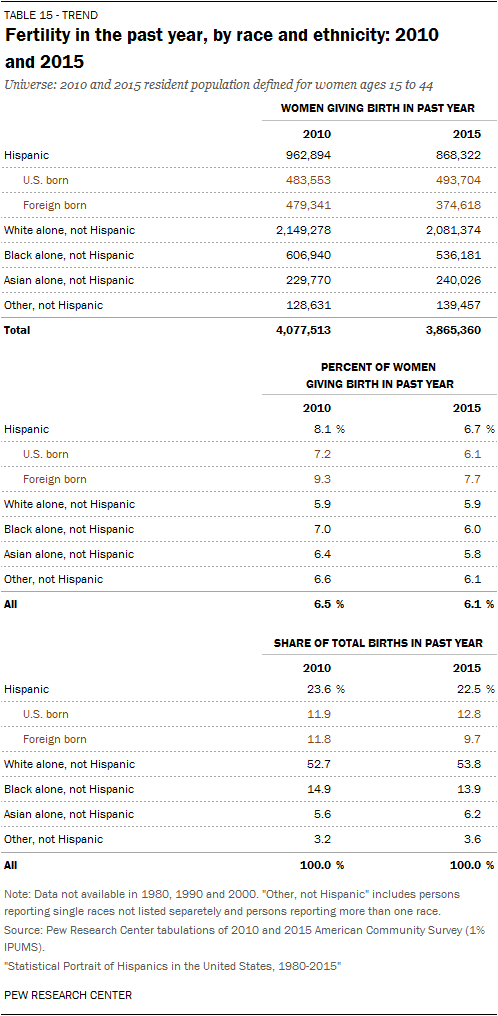
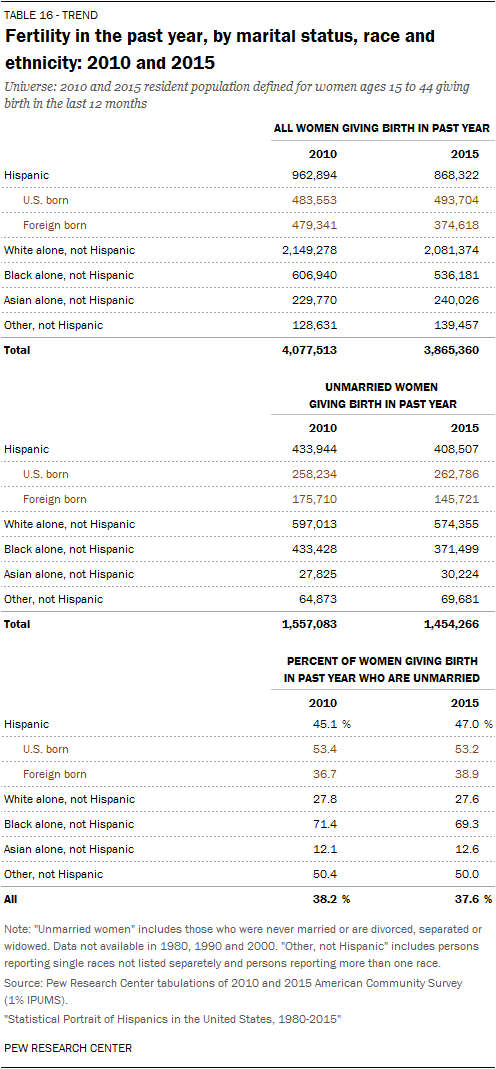
| Women ages 15-44 giving birth in past year | N/A | N/A | N/A | 8.1% | 6.7% |


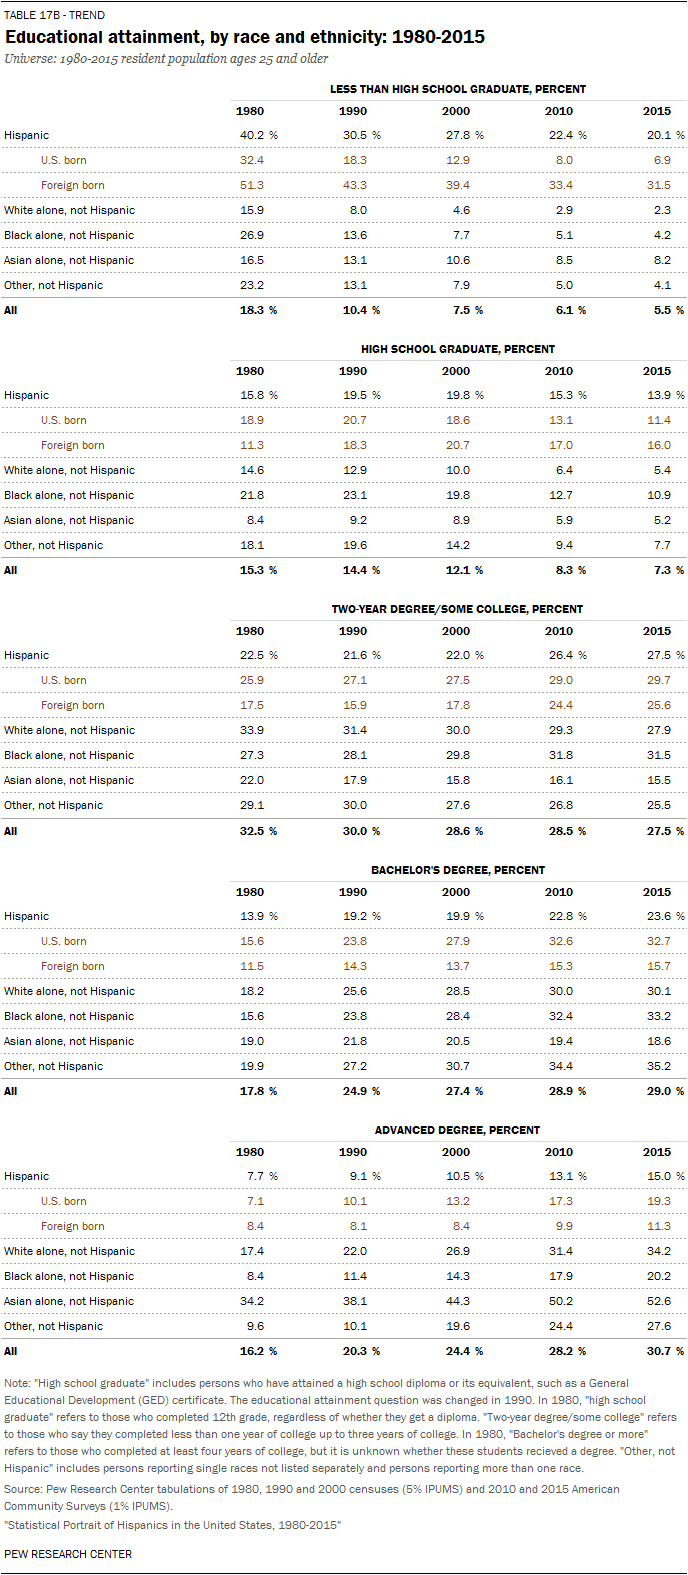
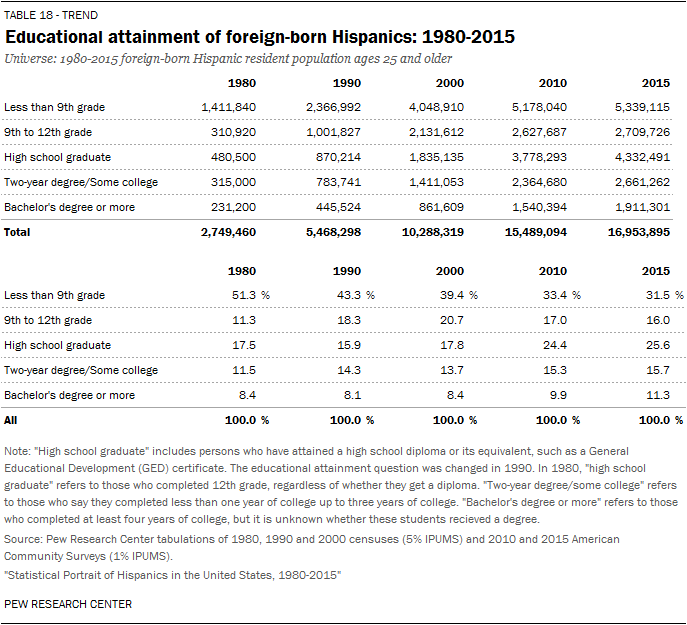
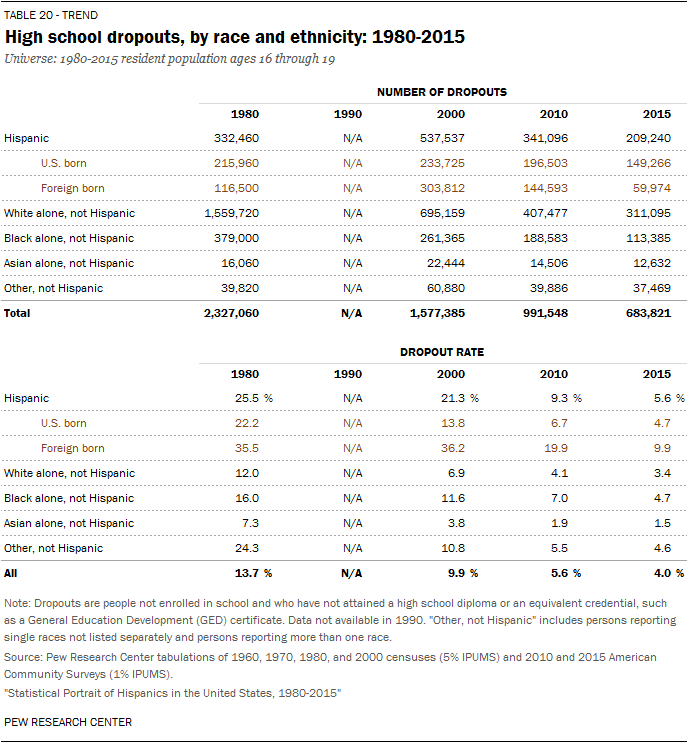
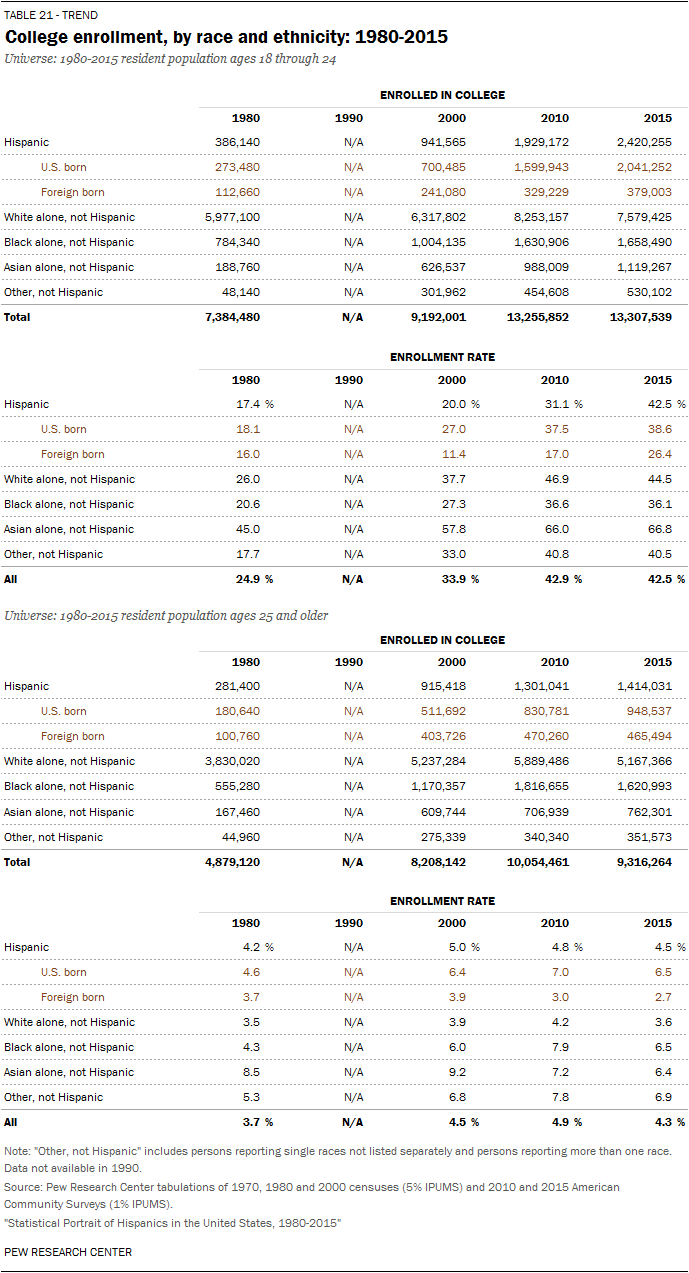
Educational Attainment and Enrollment (highest degree completed, ages 25 and older)
| 1980 | 1990 | 2000 | 2010 | 2015 | |
| High school graduate or less | 78.4% | 71.7% | 69.6% | 64.1% | 61.4% |
| Two-year degree/Some college | 13.9% | 19.2% | 19.9% | 22.8% | 23.6% |
| Bachelor’s degree or more | 7.7% | 9.1% | 10.5% | 13.1% | 15.0% |

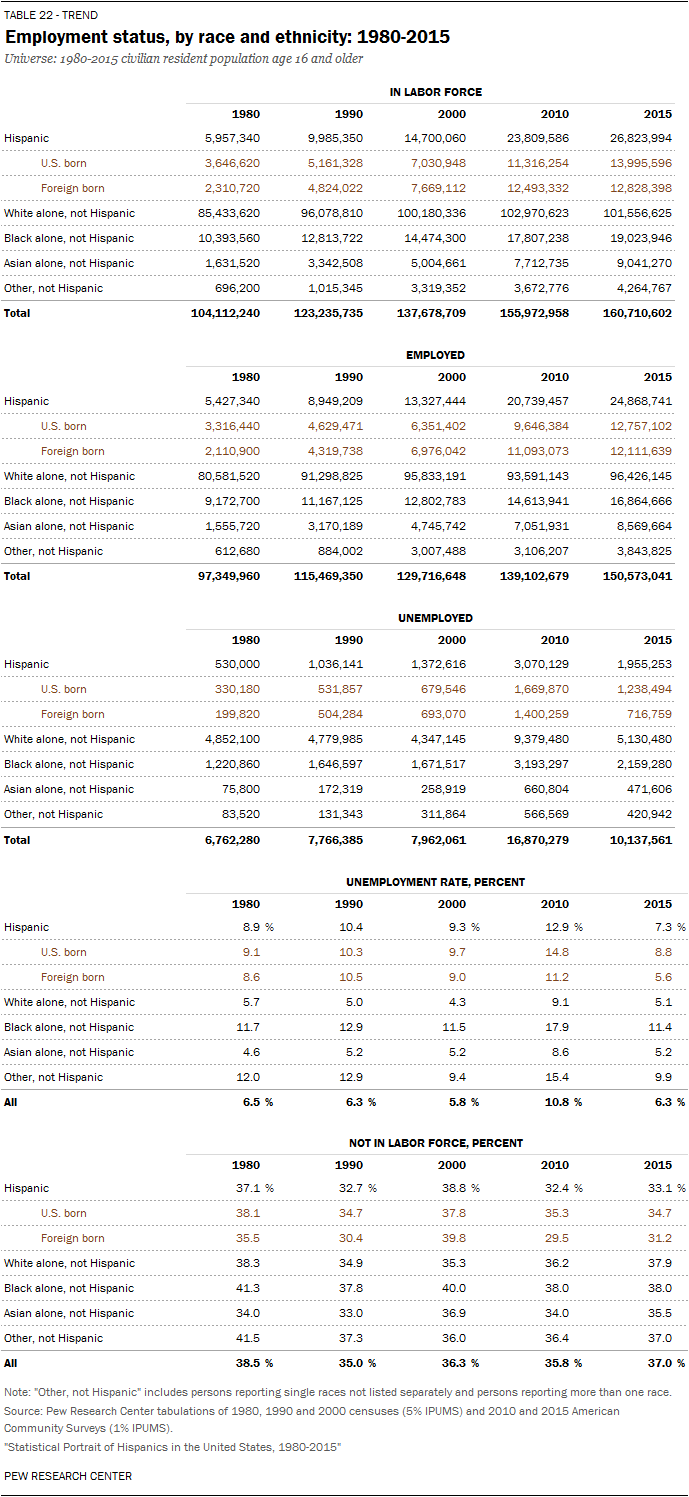
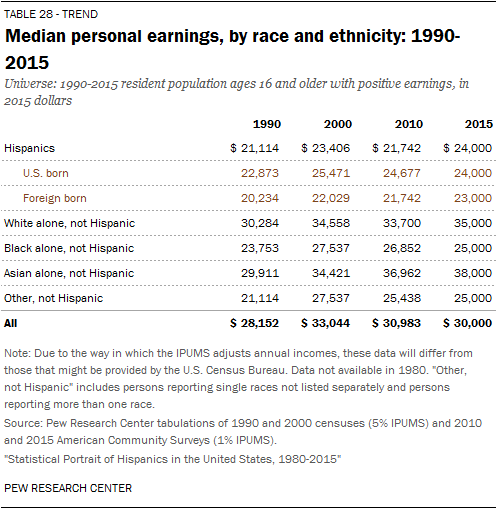
Work/Earnings/Income (ages 16 and older)
| 1980 | 1990 | 2000 | 2010 | 2015 | |
| In labor force (among civilian population) | 62.9% | 67.3% | 61.2% | 67.6% | 67.0% |
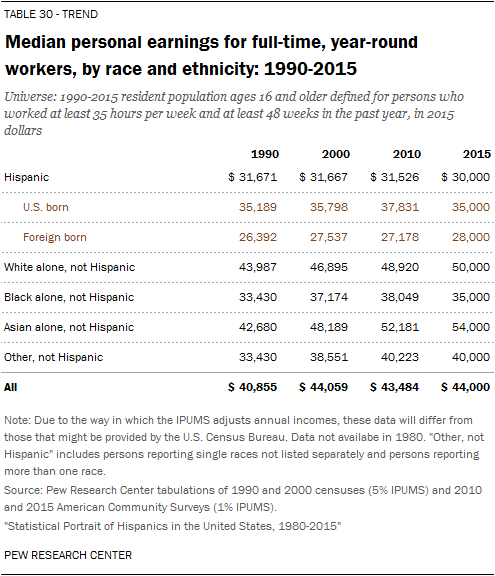
| Median annual personal earnings (in 2015 dollars, among those with earnings) |
N/A | $21,114 | $23,406 | $21,742 | $24,000 |
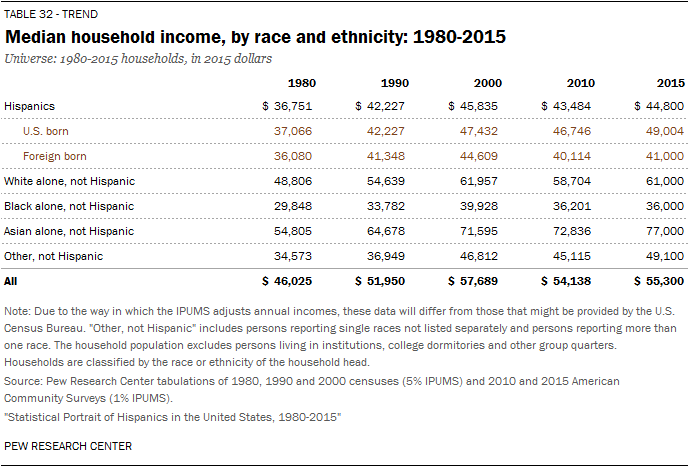
| Median annual household income (in 2015 dollars) | $36,751 | $42,227 | $45,835 | $43,484 | $44,800 |
Poverty
| 1980 | 1990 | 2000 | 2010 | 2015 | |
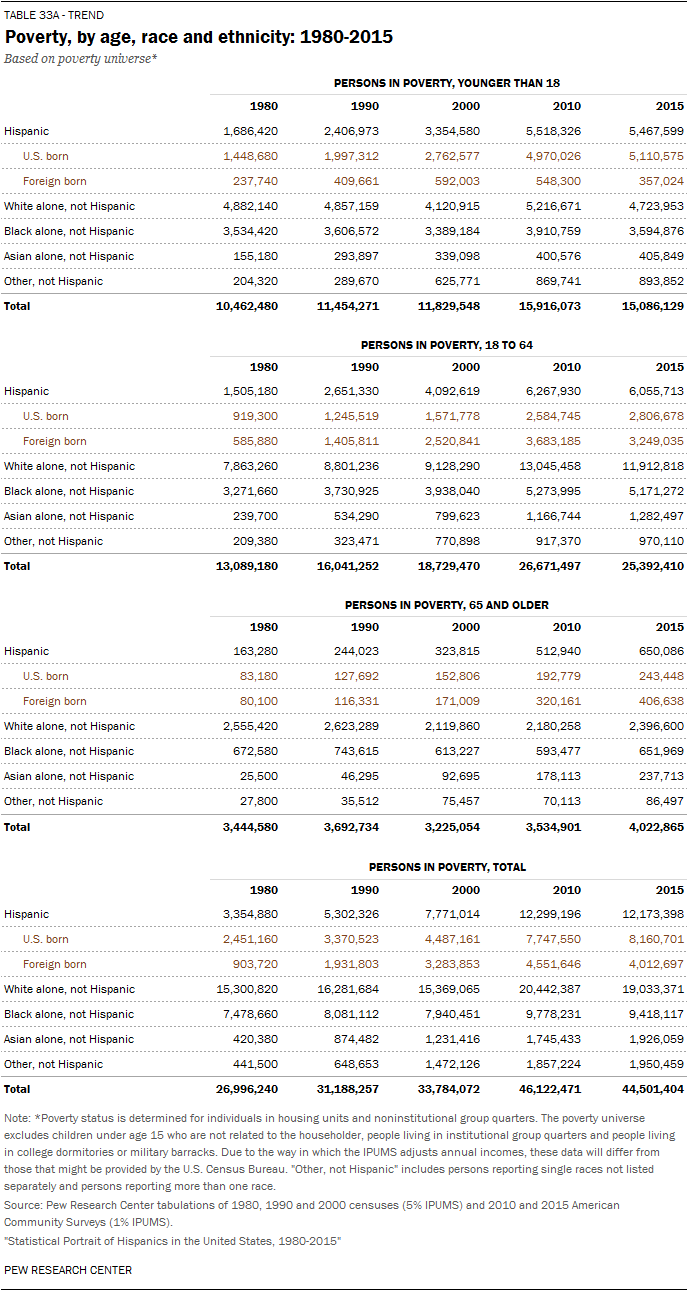
| Living in poverty | 23.2% | 24.9% | 22.5% | 24.7% | 21.9% |


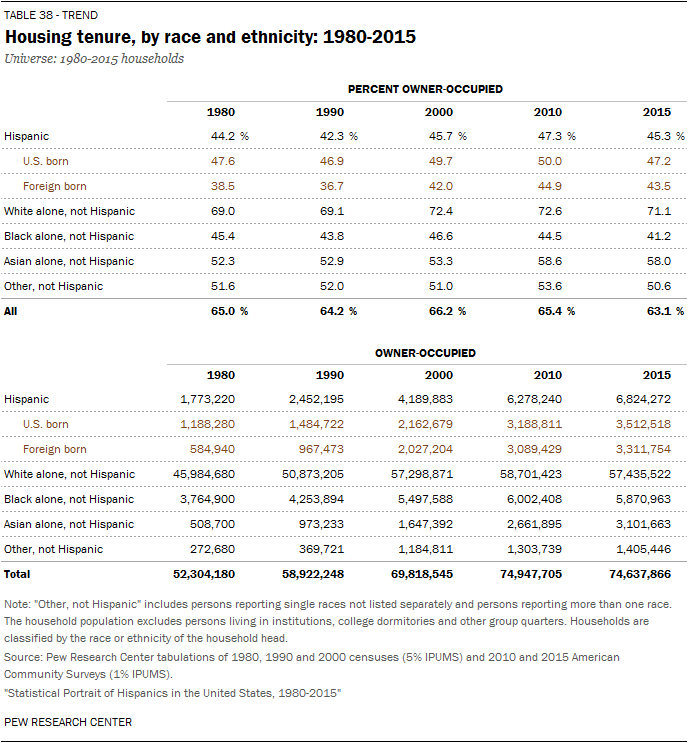
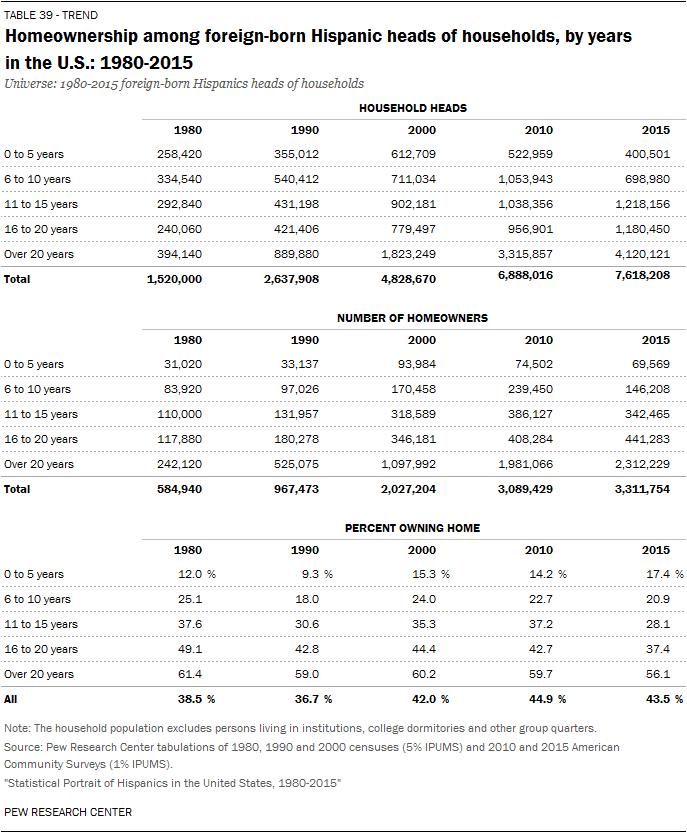
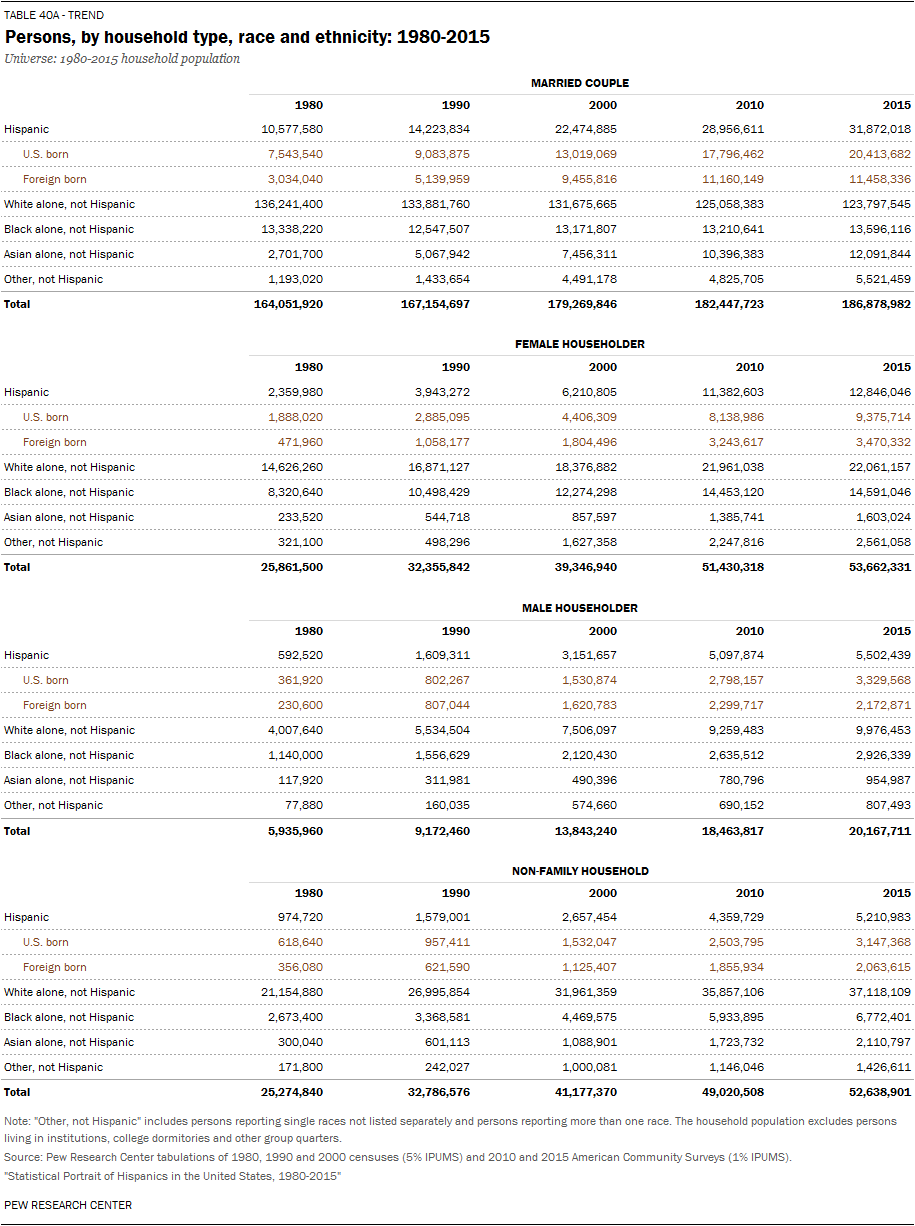
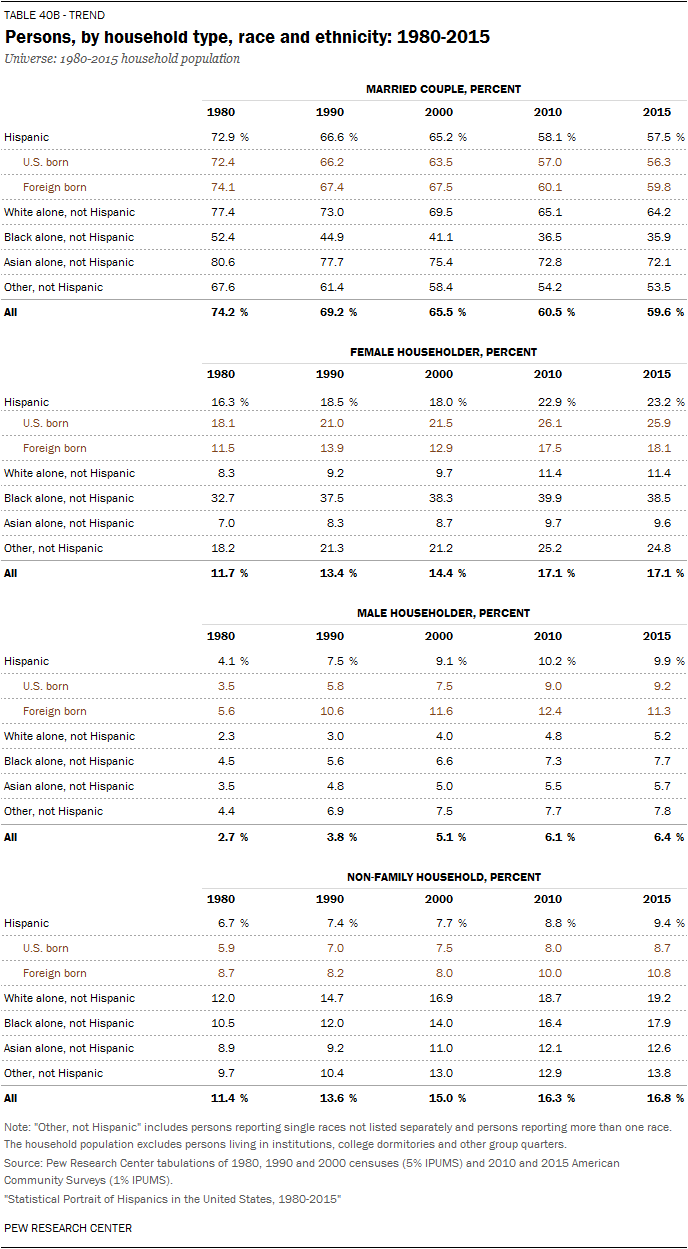
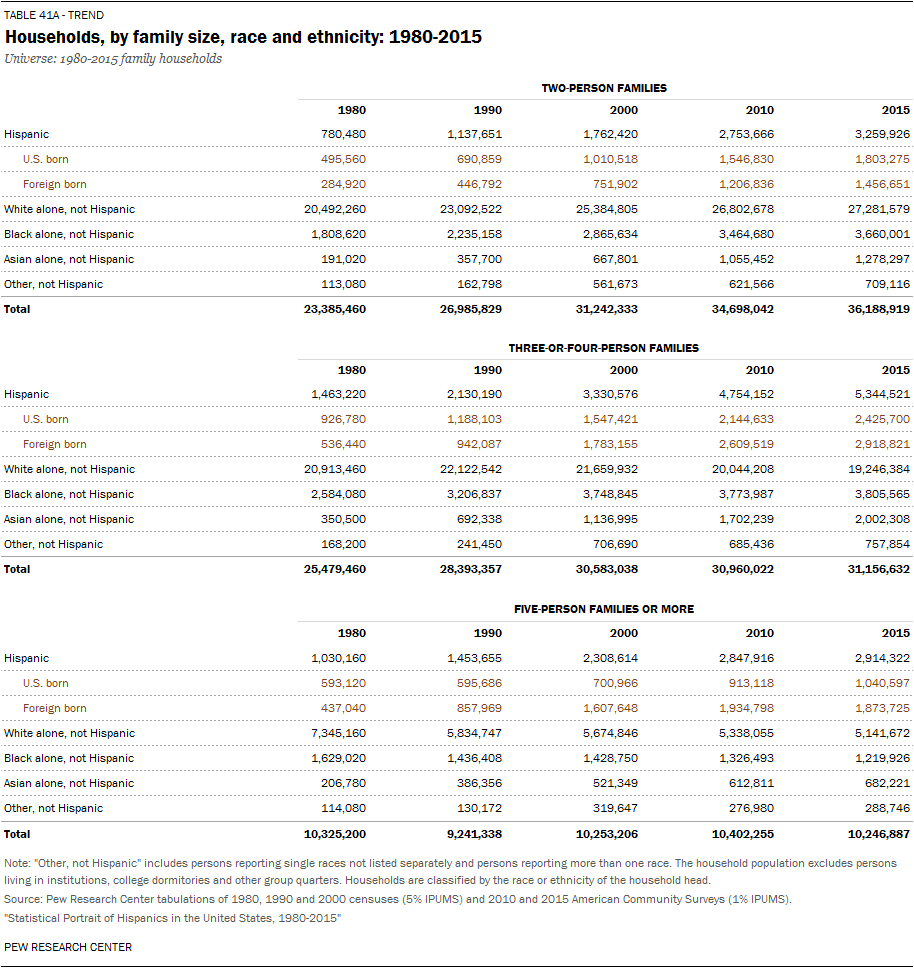
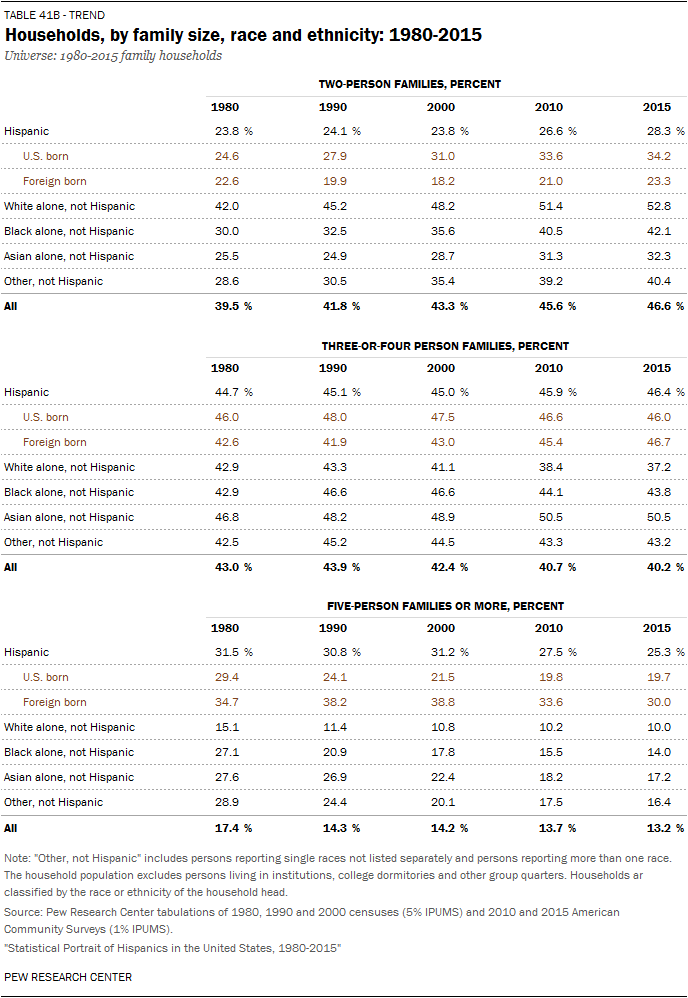
Homeownership and Household Characteristics
| 1980 | 1990 | 2000 | 2010 | 2015 | |
| In family households | 93.3% | 92.6% | 92.3% | 91.2% | 90.6% |

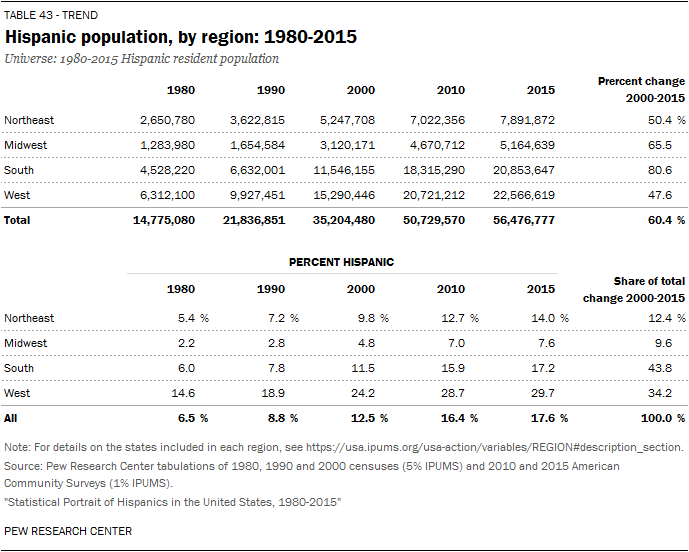
Region and Top Five States of Residence
| 1980 | 1990 | 2000 | 2010 | 2015 | |
| West | 42.7% | 45.5% | 43.4% | 40.8% | 40.0% |
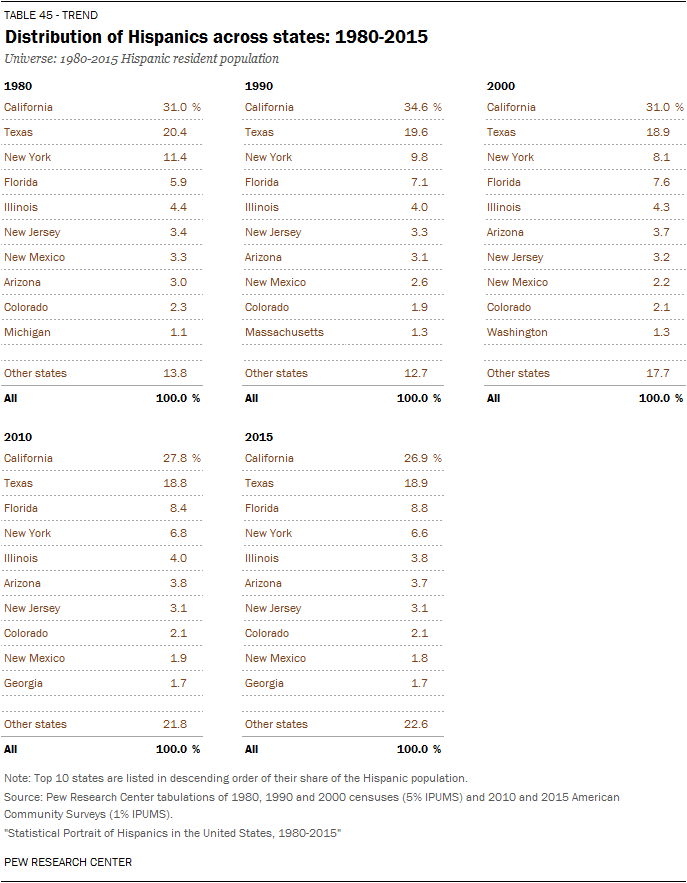
| California | 31.0% | 34.6% | 31.0% | 27.8% | 26.9% |
| South | 30.6% | 30.4% | 32.8% | 36.1% | 36.9% |
| Texas | 20.4% | 19.6% | 18.9% | 18.8% | 18.9% |
| Florida | 5.7% | 7.1% | 7.6% | 8.4% | 8.8% |
| Northeast | 17.9% | 16.6% | 14.9% | 13.8% | 14.0% |
| New York | 11.4% | 9.8% | 8.1% | 6.8% | 6.6% |
| Midwest | 8.7% | 7.6% | 8.9% | 9.2% | 9.1% |
| Illinois | 4.4% | 4.0% | 4.3% | 4.0% | 3.8% |
Source: Pew Research Center tabulations of 1960, 1970, 1980, 1990 and 2000 censuses and 2010 and 2015 American Community Surveys (IPUMS). Total foreign-born population estimates for 1960-2000 shown here may differ from other reported estimates since they are based on IPUMS data files (1% samples in 1960 and 1970 and 5% samples in 1980, 1990 and 2000), and are not based on U.S. Census Bureau population estimates.
“Statistical Portrait of the Foreign-Born Population in the United States, 1960-2015”
