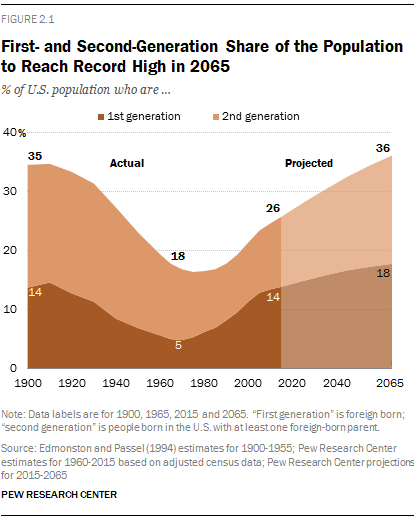
 Foreign-born Americans and their descendants have been the main driver of U.S. population growth, as well as of national racial and ethnic change, since passage of the 1965 law that rewrote national immigration policy. They also will be the central force in U.S. population growth and change over the next 50 years.
According to new Pew Research Center projections, immigrants will make up a record 18% of the U.S. population in 2065, compared with 14% today and 5% in 1965. Immigrants and their children will represent 36% of the U.S. population in 2065, which equals or surpasses the peak levels last seen around the turn of the 20th century. That share will represent a doubling since 1965 (18%) and a notable rise from today’s 26%.
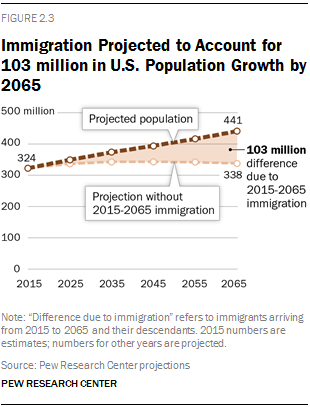
The arrival of new immigrants and the births of their children and grandchildren account for 55% of the U.S. population increase from 193 million in 1965 to 324 million today. The new Pew Research Center projections also show that the nation is projected to grow to 441 million in 2065 and that 88% of the increase is linked to future immigrants and their descendants.
Immigration has had only a modest impact on the nation’s age structure, but a striking one on its racial and ethnic makeup.8 Without immigration since 1965, the U.S. today would have a median age of 41, not 38. The nation would be 75% white instead of 62%. Hispanics would be 8% of the population, not 18%. And Asians would be less than 1% of Americans, instead of 6%.
Immigration’s Contribution to U.S. Population Size and Growth
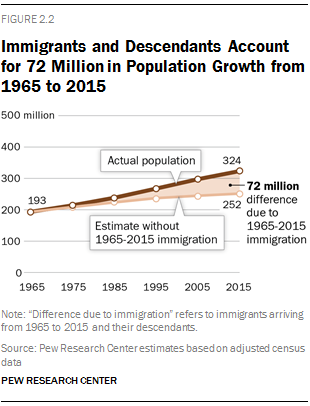 The nation’s population grew by 131 million people from 1965 to 2015, and 72 million of them are linked to immigration—that is, they are immigrants who arrived during this period or they are their children or grandchildren.
If no immigrants had entered the country after 1965, when the U.S. population numbered 193 million, the nation’s population still would have grown—to 252 million people by 2015, rather than 324 million. The population would have grown by less than half as much as it actually did (30% vs. 67% growth).
Over the next five decades, the U.S. immigrant population of 45 million is projected to grow to a record 78 million.9 The growth rate of 74% will be more than double that for the U.S.-born population (30%).
 Foreign-born U.S. residents will make up 18% of the population by 2065, higher than the previous record share of nearly 15% during the late 19th- and early 20th-century wave of immigration. The U.S.-born children of immigrants—the second generation—will more than double in number by 2065, from 38 million to 81 million, and will become 18% of the total population.
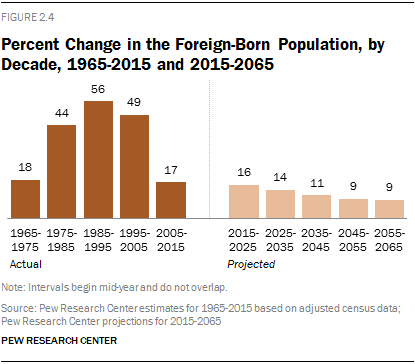
Since 1965, when the U.S. had 9.6 million immigrants, the total foreign-born population has more than quadrupled. The growth rate rose for each 10-year period from 1965 to 1995, peaking at 56% growth from 1985 to 1995. The volume of immigration grew from 1995 to 2005, though the growth rate of the foreign born decreased slightly (49%). From 2005 to 2015, the growth rate of the foreign born declined substantially, to 17%, largely because of a sharp drop in unauthorized immigration, especially from Mexico (Passel, Cohn and Gonzalez-Barrera, 2012).
Projection Methods
 The new Pew Research projections are calculated based on immigration rates, birth rates and death rates that are derived from past trends and assumptions about future patterns. Among the assumptions are that the current slowdown in immigration will last through the decade, but that growth will pick up somewhat after that. Fertility rates are not projected to rise, but rates will vary by group. Lifespans are projected to improve modestly.
These projections employ today’s racial categories. It should be noted that race and ethnicity are fluid concepts that can change through social consensus, personal self-identification or other means (Liebler et al., 2014; Pew Research Center, 2015b; Wang, 2015). For more details on assumptions and racial categories, see Appendix A: Methodology.
The immigrant population is expected to rise within a range of about 9% to 16% each decade from 2015 to 2065. By comparison, the overall U.S. population is projected to grow by 5% to 8% each decade.
Immigrants contribute to population growth because of both their own numbers and their above-average fertility. Most of those who immigrate are working-age adults, so immigrants are more likely than U.S.-born residents to be in their child-bearing years. They also have higher age-adjusted birth rates than people born in the U.S. (Livingston and Cohn, 2012).
Immigrant Generations
Immigrants made up only 5% of the U.S. population in 1965, compared with 14% today. The second generation, the children of immigrants, represent about the same share of the population today (12%) as in 1965 (13%). However, as shown below, today’s children of immigrants are considerably younger than their counterparts in 1965, and they are less likely to be white.
The second generation, today representing 38 million children of immigrants, is projected to be a major force driving future population growth. The foreign-born population has grown more rapidly than the second generation over the past five decades, but the second generation is projected to grow at a faster pace over the next five decades. The number of second-generation Americans is projected to more than double by 2065, to 81 million, when they will slightly outnumber the 78 million foreign-born Americans.
The third-and-higher generations—those born in the U.S. to U.S.-born parents—will grow more slowly, by 17% over the next five decades. This group now makes up about three-quarters (74%) of the U.S. population, but it will decline to about two-thirds (64%) in 2065.
Past Racial and Hispanic Change
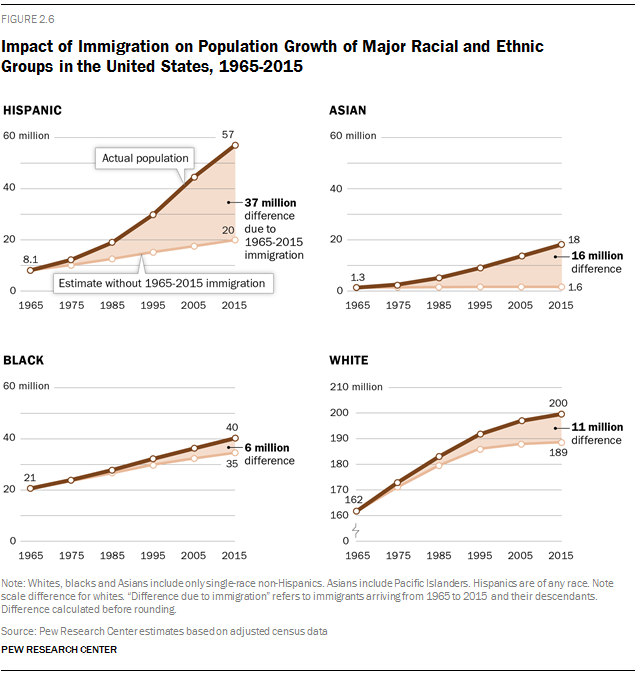
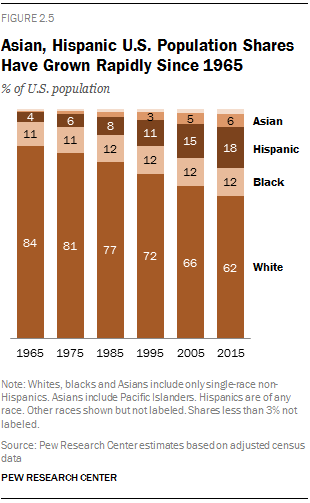 Immigration is the primary reason behind the striking growth in the nation’s Hispanic and Asian populations since passage of the 1965 immigration law that ended a visa system favoring Europe over other regions of the world. Immigrants and their descendants account for most growth in the Hispanic population (76%) and virtually all growth in the Asian population (98%) from 1965 to 2015.
Five decades ago, the U.S. was a mainly (84%) white nation with an 11% black minority. Hispanics of all races made up 4% of the population, and other races made up the remaining 1%. All these groups grew in the ensuing 50 years, especially Hispanics, whose numbers grew sevenfold, and Asians, whose numbers rose more than thirteenfold.
The Hispanic share of the population more than quadrupled from 1965 to 2015, to 18%, and the Asian share more than quintupled, to 6%. The white share declined (to 62% in 2015), and the black share changed little (to 12% in 2015).
The Hispanic population, 8 million in 1965, is nearly 57 million in 2015. The Asian population, 1.3 million in 1965, grew to 18 million in 2015.
The white and black populations did not grow as sharply, and less than a third of growth for each race (29%) can be linked to immigration. The 1965 white population of nearly 162 million grew to 200 million in 2015. The black population, 21 million in 1965, increased to 40 million in 2015.
Looking at immigrants’ total contribution to population growth, by racial and ethnic group, Hispanics and their descendants can be linked to 28% of the overall U.S. increase over the past five decades. Asian immigrants and their descendants contributed 13% of growth. White immigrants and their descendants accounted for 8%, and black immigrants and their descendants are linked to 4% of overall growth over the past five decades. An additional 45% of growth was not linked to immigration, but to births to people living in the U.S. in 1965 and their descendants.
Projected Future Racial and Hispanic Change
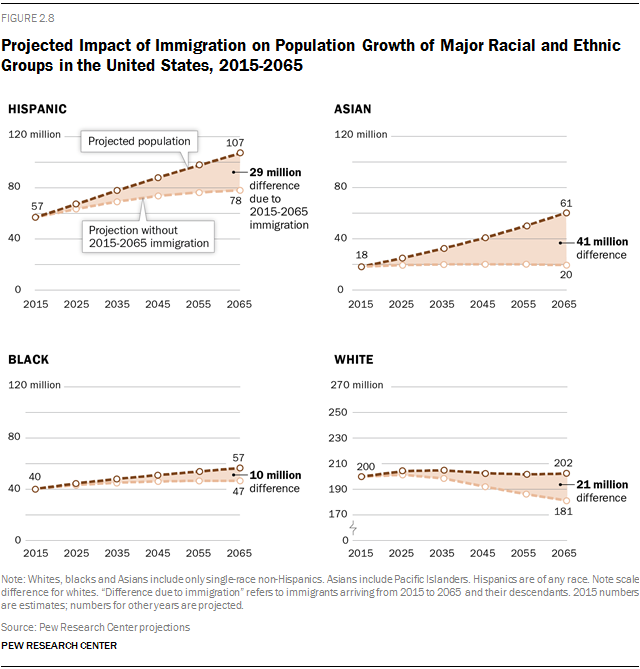
 Over the next five decades, the majority of U.S. population growth is projected to be linked to new Asian immigration (35%) and new Hispanic immigration (25%). An additional 18% will be due to new white immigrants and their descendants, and 8% to black immigrants and their descendants.10 Only about 12% of projected growth is attributable to the population already in the country in 2015 and its descendants.
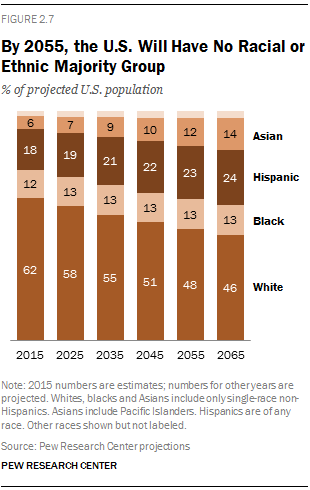
Differing growth rates of the nation’s racial and ethnic groups will reshape the U.S. demographic profile. By 2055, the United States will be a nation without a majority racial or ethnic group. The Hispanic and Asian populations will continue to grow more rapidly than whites and blacks. The white population, now 62% of the total, will decline to less than 50% sometime between 2050 and 2055.
In 2065, according to Pew Research projections, whites will make up 46% of the population and Hispanics 24%. Asians will be 14% of the total; after 2060, they are projected to surpass blacks, who will be 13% of the U.S. population.
Nearly all (97%) of the growth in the nation’s Asian population over the next five decades will be due to new immigrants, their children and grandchildren. Most growth will be due to immigration for Hispanics (57%) and blacks (61%). The white population, projected to rise by 1% from 2015 to 2065, would decline by 9% without new immigrants and their descendants.
Race and Ethnicity Among Immigrants
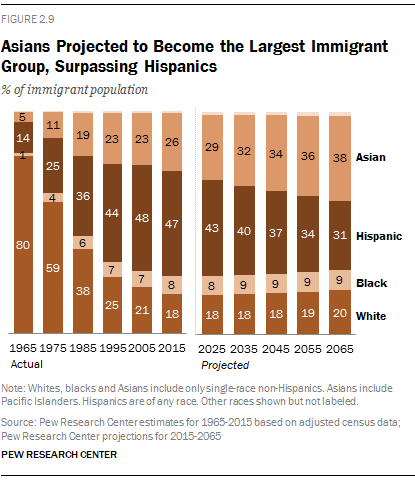 Among immigrants, the white share of the foreign-born population will remain at a historic low over the next five decades. Based on Pew Research Center assumptions about immigration, fertility and mortality rates, Asians are projected to surpass Hispanics as the largest single group among the foreign-born population, beginning in 2055.
In 1965, most immigrants (80%) were white, but immigration over the subsequent five decades was dominated by Hispanics and Asians. In 2015, only 18% of immigrant population was white; in 2065, 20% are projected to be white. The Hispanic share of immigrants, now 47%, will decline to 31% as a growing share of Hispanic growth is fed by births in the U.S. and not new immigration. Asians, who surpassed Hispanics among new immigrants by 2011, are projected to rise to 38% of the immigrant population in 2065 from today’s 26%.11
Asians will be a growing share of the second generation (26% in 2065), but Hispanics will remain the largest single group in the second generation (40%). In 2065, Hispanics will nearly triple their representation in the third-and-higher generation (18% from today’s 8%), but Asians will remain a small share (3%) of this group.
The combined share of immigrants and children of immigrants—sometimes called “immigrant stock”—varies widely among the nation’s major race and ethnic groups. The white and black shares are expected to rise over the next five decades, while the Hispanic and Asian shares will decline somewhat.
In 1965, nearly one-in-five whites (18%) were immigrants or the children of immigrants, which declined to 10% in 2015 but will rebound to 16% in 2065. Among blacks, only 1% were immigrants or the children of immigrants in 1965, which rose to 15% in 2015 and will go up to 27% in 2065. Among Hispanics, 38% were first or second generation in 1965, compared with 68% today and just over half (53%) in 2065, according to projections. Among Asians, 69% were first or second generation in 1965, 93% are today and 84% are projected to be in 2065.
Today, Asians are the only major racial or ethnic group whose numbers are rising mainly because of immigration. Although immigration contributes to growth of the U.S. Hispanic population, births in the U.S. to Hispanic women are a more important contributor. Births overtook immigration as the main driver of Latino population growth after 2000 (Krogstad and Lopez, 2014).
Nearly two-thirds of the Asian population (64%) is foreign born, compared with 37% of U.S. Hispanics. About a quarter (23%) of the Hispanic population will be foreign born in 2065, and barely half (49%) of the Asian population will be immigrants.
Due to a gradual increase in black immigration, 13% of blacks will be foreign born, compared with 9% today. The white population will have only an 8% share of immigrants, compared with 4% today.
Median Age
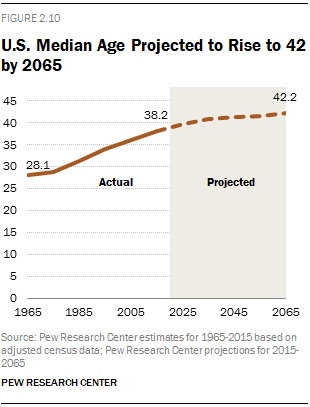 In 1965, immigration rates had been low for several decades, so both immigrants and their U.S.-born children were considerably older than the U.S. population overall. The contrast is striking in terms of median age—the age at which half the population is older and half younger. For the U.S. population overall, in 1965, the year after the end of the post-World War II baby boom, the median age was 28.
The median age for immigrants was 56. The median age for the second generation, whose parents mainly came during the early 20th-century wave of immigration, was 45.
By 2015, the U.S. population was older, with a median age of 38, mainly because of the aging of the large Baby Boom generation. Had there been no immigration after 1965, the population would have been slightly older, with a median age of nearly 41. Today’s immigrant population is substantially younger than in 1965, with a median age of nearly 45.
The most striking change, though, is in the second generation. The children of immigrants today have a median age of 19, so they are about a quarter century younger than their counterparts in 1965 and are substantially younger than the overall population.
The U.S. median age is projected to rise steadily, reaching 42 in 2065. The median age of foreign-born Americans is projected to reach nearly 53, close to its level in 1965. The median age of the second generation will increase even more sharply, to 36, though this group is projected to remain slightly younger than the overall population. Over the next five decades, projected immigration would have the impact of keeping the median age of the overall population slightly lower than it would be otherwise, by 2.7 years.


 Key Charts
 Timeline
 Map
Map