Overview
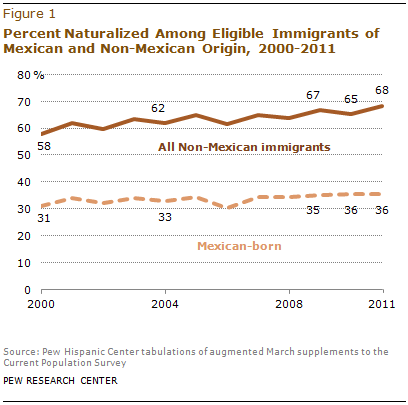
 Nearly two-thirds of the 5.4 million legal immigrants from Mexico who are eligible to become citizens of the United States have not yet taken that step. Their rate of naturalization—36%—is only half that of legal immigrants from all other countries combined, according to an analysis of Census Bureau data by the Pew Hispanic Center, a project of the Pew Research Center.
Creating a pathway to citizenship for immigrants who are in the country illegally is expected to be one of the most contentious elements of the immigration legislation that will be considered by Congress this year. Mexican immigrants are by far the largest group of immigrants who are in the country illegally—accounting for 6.1 million (55%) of the estimated 11.1 million in the U.S. as of 2011.
Mexicans are also the largest group of legal permanent residents—accounting for 3.9 million out of 12 million. The Center’s analysis of current naturalization rates among Mexican legal immigrants suggests that creating a pathway to citizenship for immigrants in the country illegally does not mean all would pursue that option. Many could choose an intermediate status—legal permanent resident—that would remove the threat of deportation, enable them to work legally and require them to pay taxes, but not afford them the full rights of U.S. citizenship, including the right to vote.
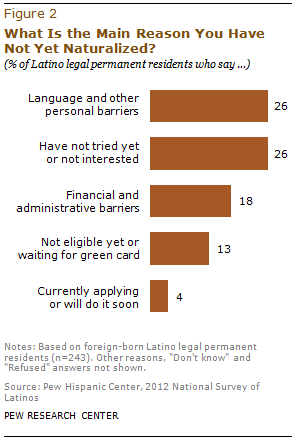
 A nationwide survey of Hispanic immigrants by the Pew Hispanic Center finds that more than nine-in-ten (93%) who have not yet naturalized say they would if they could. Asked in an open-ended question why they hadn’t naturalized, 26% identified personal barriers such as a lack of English proficiency, and an additional 18% identified administrative barriers, such as the financial cost of naturalization. The survey also revealed that among Hispanic legal permanent residents, just 30% say they speak English “very well” or “pretty well.” (See Appendix table A2.)
The last time the United States government created a pathway to citizenship for immigrants in the country illegally was in 1986 with the passage of the Immigration Reform and Control Act (IRCA). A 2010 study by the U.S. Department of Homeland Security found that about 40% of the 2.7 million immigrants who obtained a green card derived from IRCA had naturalized by 2009 (Baker, 2010).
This report is based on two main data sources. Latino immigrant attitudes about naturalization come from a nationally representative bilingual telephone survey of 1,765 Latino adults, including 899 immigrants. The margin of error for the full sample is plus or minus 3.2 percentage points at the 95% confidence level; for foreign-born Latinos, the margin of error is plus or minus 4.4 percentage points. For a full description of the survey methodology, see Appendix B.
Data on naturalization trends among legal immigrants are based on a Pew Hispanic Center analysis of the U.S. Census Bureau’s Current Population Survey (CPS). The CPS is a monthly survey of about 55,000 households conducted jointly by the U.S. Bureau of Labor Statistics and the Census Bureau. Each March, the CPS is expanded to produce additional data on the nation’s foreign-born population and other topics. Legal status of immigrants in the CPS is inferred based on methods described in Passel and Cohn (2010).
Among the report’s other findings:
Naturalization rates
- In 2011, Mexican immigrants had a comparatively lower rate of naturalization, 36% of those eligible, compared with 61% for all immigrants and 68% for all non-Mexican immigrants.
- Mexican naturalization rates are also lower than those of immigrants from Latin America and the Caribbean—36% versus 61% in 2011.
Reasons for naturalizing
- When asked in an open-ended question why they became U.S. citizens, almost one-in-five (18%) naturalized Latino immigrants cite civil and legal rights as their main reason for obtaining U.S. citizenship. Another 16% cite an interest in having access to the benefits and opportunities derived from U.S. citizenship and 15% give family-related reasons.
- Mexican naturalized citizens are more likely to say they became citizens for practical reasons such as obtaining civil and legal rights (22%) or specific benefits or opportunities derived from citizenship (20%). By comparison, among non-Mexican naturalized Latinos, family reasons are most often cited (16%).
Reasons for not naturalizing
- Among Latino legal permanent residents (LPRs), when asked the main reason that they had not naturalized thus far, 26% identify personal barriers and another 18% identify administrative barriers.
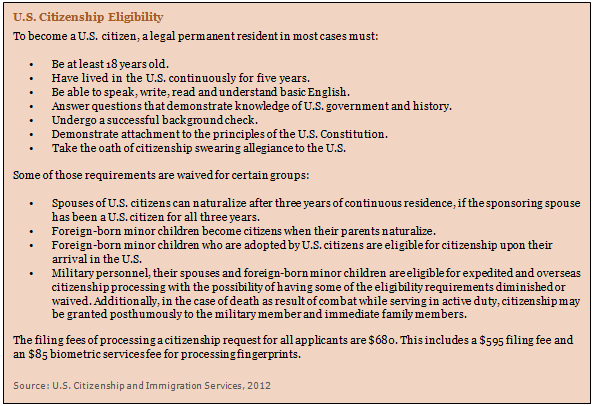
- Among those citing personal barriers, about two-thirds (65%) say they need to learn English, and close to a fourth (23%) say they find the citizenship test too difficult. Among those who cite administrative barriers, more than nine-in-ten (94%) say the reason they have not naturalized is the cost of the naturalization application, which currently is $680 per application.
- Almost half (48%) of Mexican-born green card holders say the main reason they have not yet naturalized relates to either personal (33%) or administrative (16%) barriers. This compares with about four-in-ten (39%) Hispanic green card holders who were born in a country other than Mexico who say they have not naturalized due to personal (17%) or administrative (22%) barriers.

About this Report
This report explores the reasons Hispanic immigrants give for naturalizing to become a U.S. citizen—and for not naturalizing. It also shows trends in naturalization rates among immigrants who are in the country legally.
The report uses several data sources. Data on Latino immigrants’ views of naturalization are based on the Pew Hispanic Center’s 2012 National Survey of Latinos (NSL). The NSL was conducted from September 7 through October 4, 2012, in all 50 states and the District of Columbia among a randomly selected, nationally representative sample of 1,765 Latino adults, 899 of whom were foreign born. The survey was conducted in both English and Spanish on cellular as well as landline telephones. The margin of error for the full sample is plus or minus 3.2 percentage points. The margin of error for the foreign-born sample is plus or minus 4.4 percentage points. Interviews were conducted for the Pew Hispanic Center by Social Science Research Solutions (SSRS).
For data on the legal status of immigrants, Pew Hispanic Center estimates use data mainly from the Current Population Survey (CPS), a monthly survey of about 55,000 households conducted jointly by the U.S. Bureau of Labor Statistics and the Census Bureau. It is best known as the source for monthly unemployment statistics. Each March, the CPS sample size and questionnaire are expanded to produce additional data on the foreign-born population and other topics. Legal status of immigrants in the CPS is inferred based on methods described in Passel and Cohn (2010). The Pew Hispanic Center estimates make adjustments to the government data to compensate for undercounting of some groups, and therefore its population totals differ somewhat from the ones the government uses. Estimates of the number of immigrants by legal status for any given year are based on a March reference date.
Data used in this report were originally released in November 2012 as part of the Pew Hispanic Center report “An Awakened Giant: The Hispanic Electorate is Likely to Double by 2030” by Taylor, et al. (2012).
This report was written by Research Associate Ana Gonzalez-Barrera, Associate Director Mark Hugo Lopez, Senior Demographer Jeffrey S. Passel and Director Paul Taylor. Ana Gonzalez-Barrera took the lead in developing the survey questionnaire’s naturalization section. Senior Writer D’Vera Cohn provided comments on earlier drafts of the report. Research Assistant Seth Motel provided excellent research assistance. Senior Research Associate Richard Fry, Senior Editor Rich Morin, Motel and Research Assistant Eileen Patten number-checked the report text and topline. Marcia Kramer and Molly Rohal were the copy editors.
A Note on Terminology
The terms “Latino” and “Hispanic” are used interchangeably in this report.
“Foreign born” refers to persons born outside of the United States, Puerto Rico or other U.S. territories to parents neither of whom was a U.S. citizen.
The following terms are used to describe immigrants and their status in the U.S. In some cases, they differ from official government definitions because of limitations in the available survey data.
Legal permanent resident, legal permanent resident alien, legal immigrant, authorized migrant: A citizen of another country who has been granted a visa that allows work and permanent residence in the U.S. For the analyses in this report, legal permanent residents include persons admitted as refugees or granted asylum.
Naturalized citizen: Legal permanent resident who has fulfilled the length of stay and other requirements to become a U.S. citizen and who has taken the oath of citizenship.
Unauthorized migrant: Citizen of another country who lives in the U.S. without a currently valid visa.
Eligible immigrant: In this report, a legal permanent resident who meets the length of stay qualifications to file a petition to become a citizen but has not yet naturalized.
Legal temporary migrant: A citizen of another country who has been granted a temporary visa that may or may not allow work and temporary residence in the U.S.


