*Visit the most recent data.
This statistical profile of the foreign-born population is based on Hispanic Trends Project tabulations of the Census Bureau’s 2011 American Community Survey (ACS). Users should exercise caution when comparing the 2011 estimates with estimates for previous years. Population estimates in the 2011 ACS are based on the latest information from the 2010 Decennial Census; the 2005 to 2009 ACS estimates are based on the latest information available for those surveys—updates of the 2000 Decennial Census. The impact of this discontinuity on comparisons between the 2010 and later ACS and earlier years is discussed in a recent report.
 Complete Report
 Excel Workbook
 Slideshow of Key Findings
The ACS is the largest household survey in the United States, with a sample of about 3 million addresses. It covers the topics previously covered in the long form of the decennial census. The ACS is designed to provide estimates of the size and characteristics of the resident population, which includes persons living in households and group quarters.
The specific data sources for this statistical profile are the 1% sample of the 2011 ACS Integrated Public Use Microdata Series (IPUMS) and the 5% sample of the 2000 Census IPUMS provided by the University of Minnesota.1 The IPUMS assigns uniform codes, to the extent possible, to data collected by the decennial census and the ACS from 1850 to 2011. Due to differences in the way in which the IPUMS and Census Bureau adjust income data and assign poverty status, data provided in Tables 31 – 37 might differ from data on these variables that are provided by the Census Bureau. For more information about the IPUMS, including variable definition and sampling error, please visit http://usa.ipums.org/usa/design.shtml. To learn more about the sampling strategy and associated error of the 2000 Census or the 2011 American Community Survey, please refer to Chapter 8 of the U.S. Census Summary File 3: 2000 and U.S. Census Design Methodology, respectively.
For the purposes of this statistical portrait, the foreign born include those persons who identified as naturalized citizens or non-citizens and are living in the 50 states or the District of Columbia. Persons born in Puerto Rico and other outlying territories of the U.S. and who are now living in the 50 states or the District of Columbia are included in the native-born population.
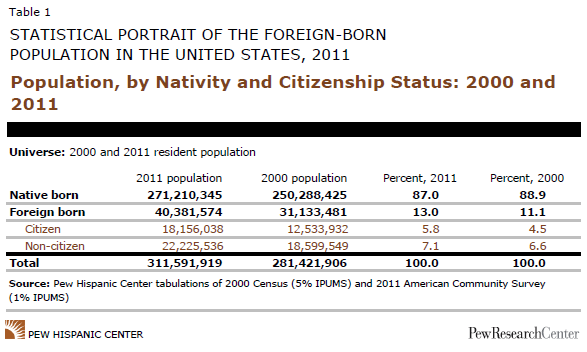
- Population, by Nativity and Citizenship Status: 2000 and 2011
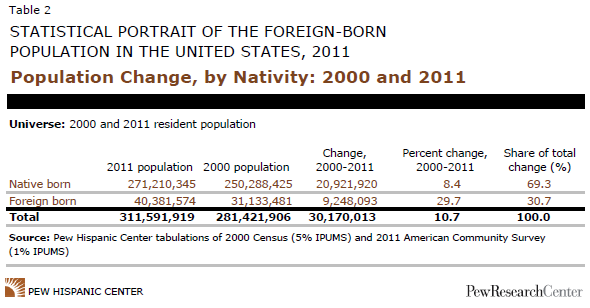
- Population Change, by Nativity: 2000 and 2011
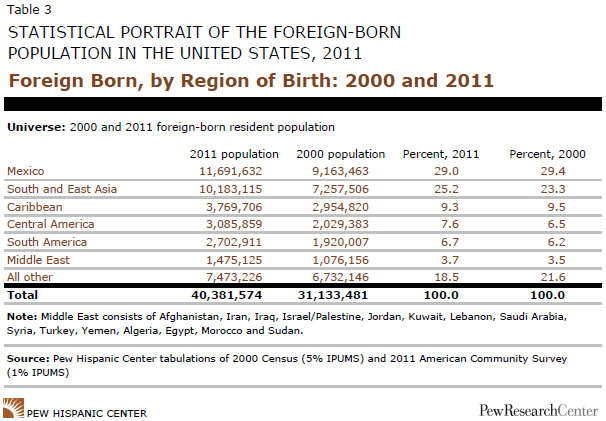
- Foreign Born, by Region of Birth: 2000 and 2011
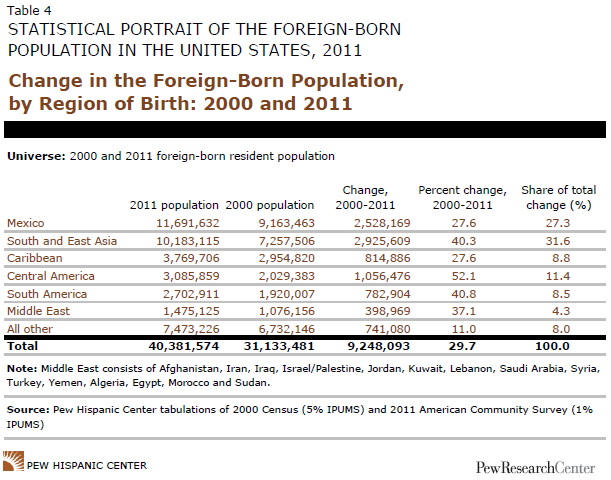
- Change in the Foreign-Born Population, by Region of Birth: 2000 and 2011
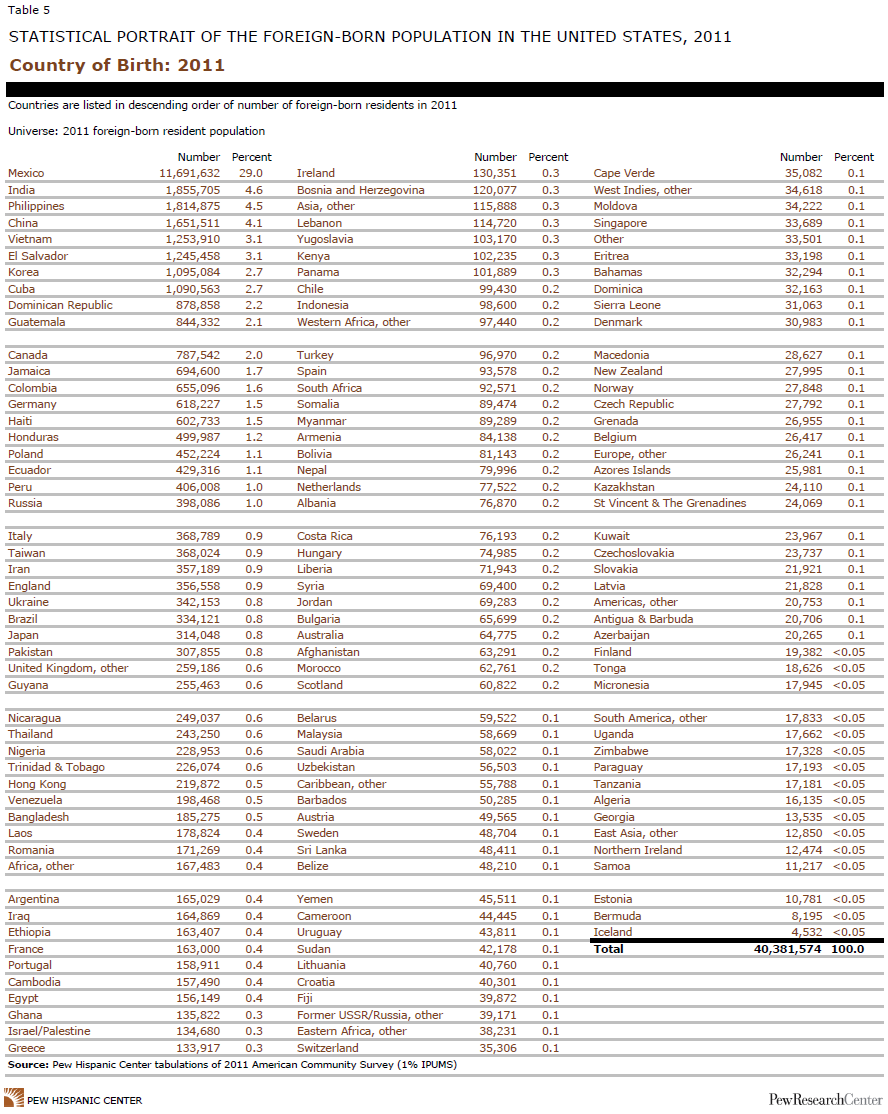
- Country of Birth: 2011
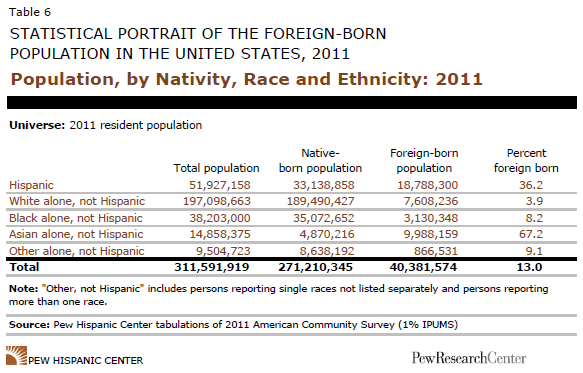
- Population, by Nativity, Race and Ethnicity: 2011
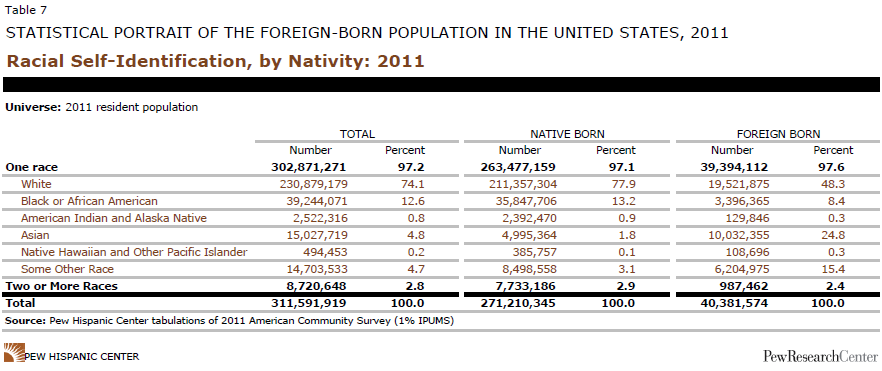
- Racial Self-Identification, by Nativity: 2011
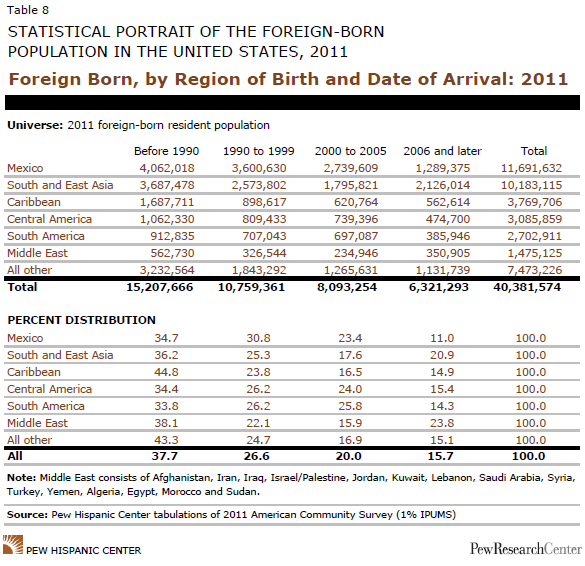
- Foreign Born, by Region of Birth and Date of Arrival: 2011
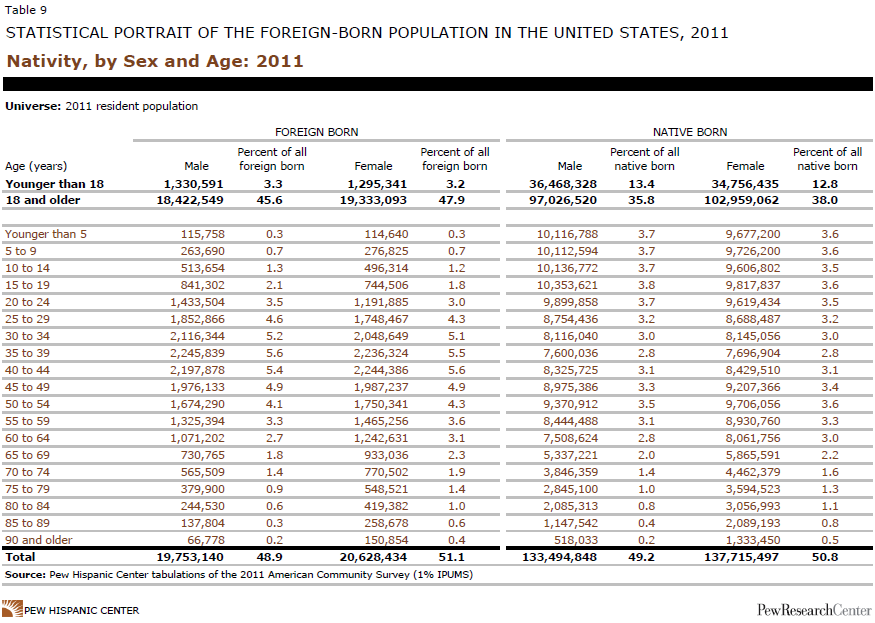
- Nativity, by Sex and Age: 2011
- Age and Gender Distributions for Nativity Groups: 2011
- Median Age in Years, by Sex and Region of Birth: 2011
- Foreign Born, by State: 2011
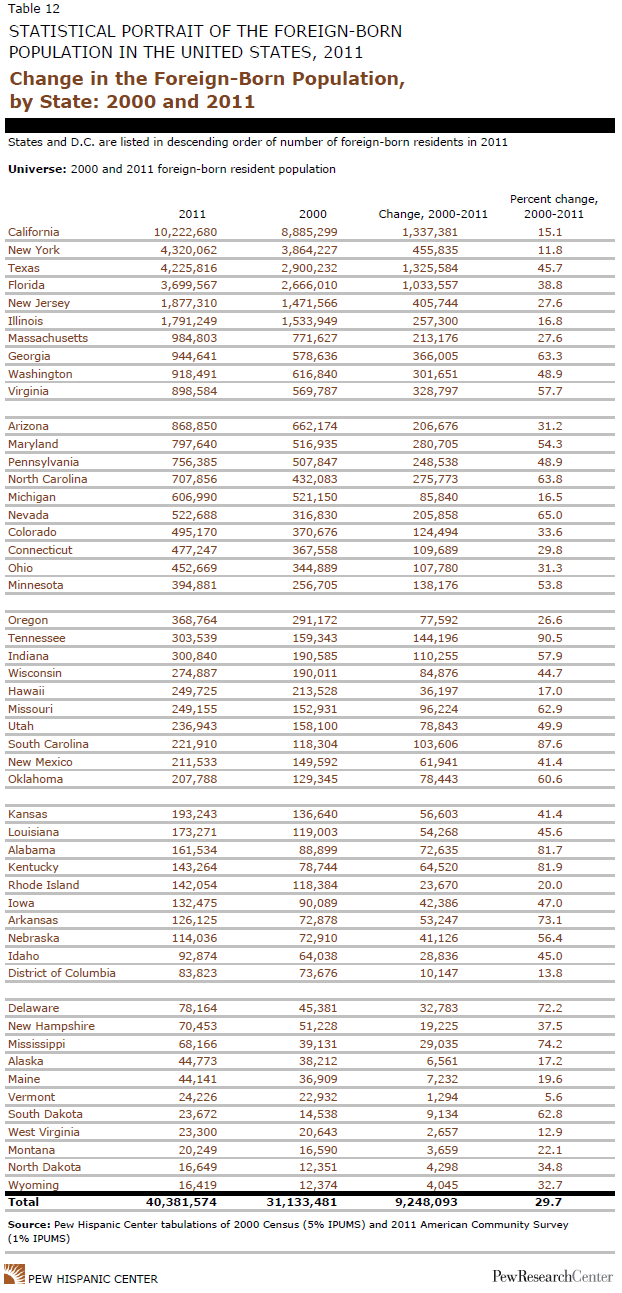
- Change in the Foreign-Born Population, by State: 2000 and 2011
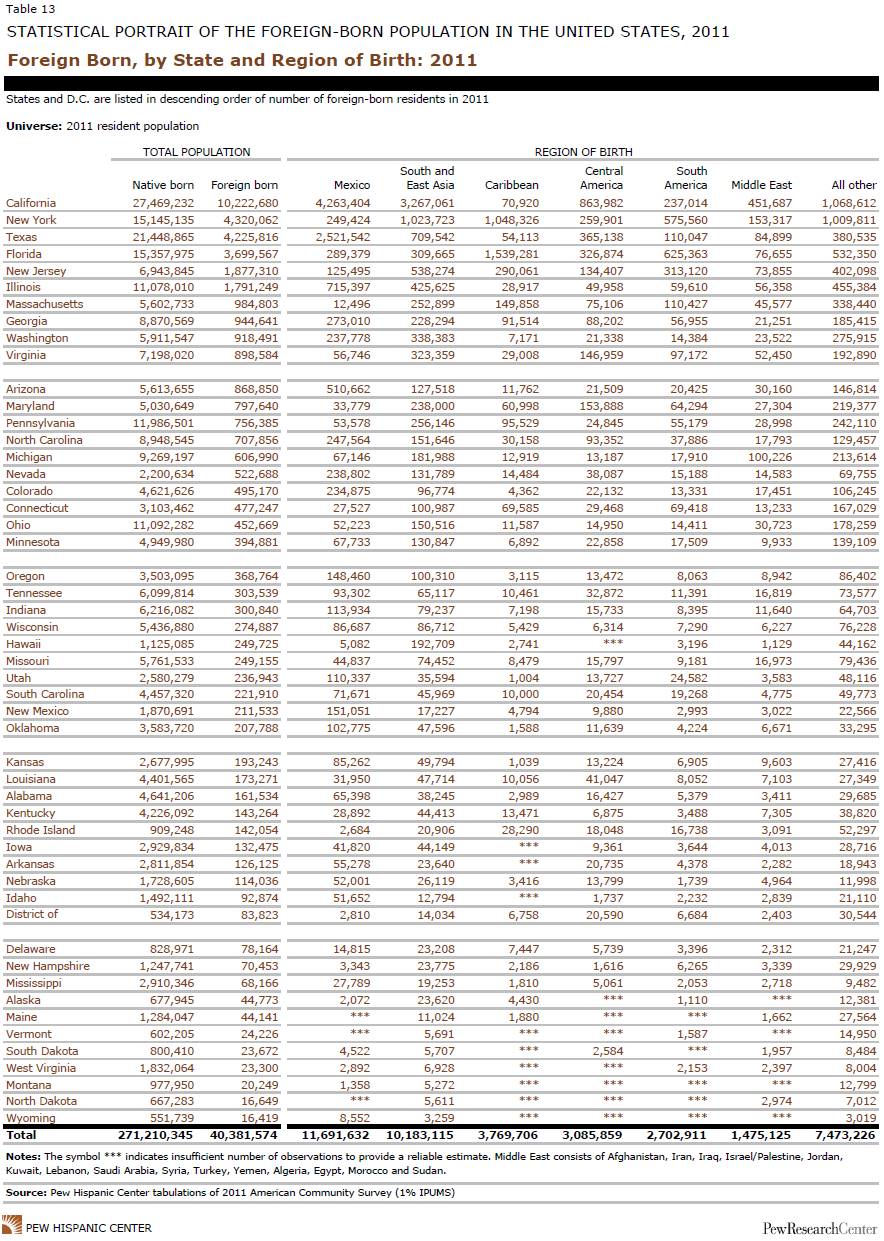
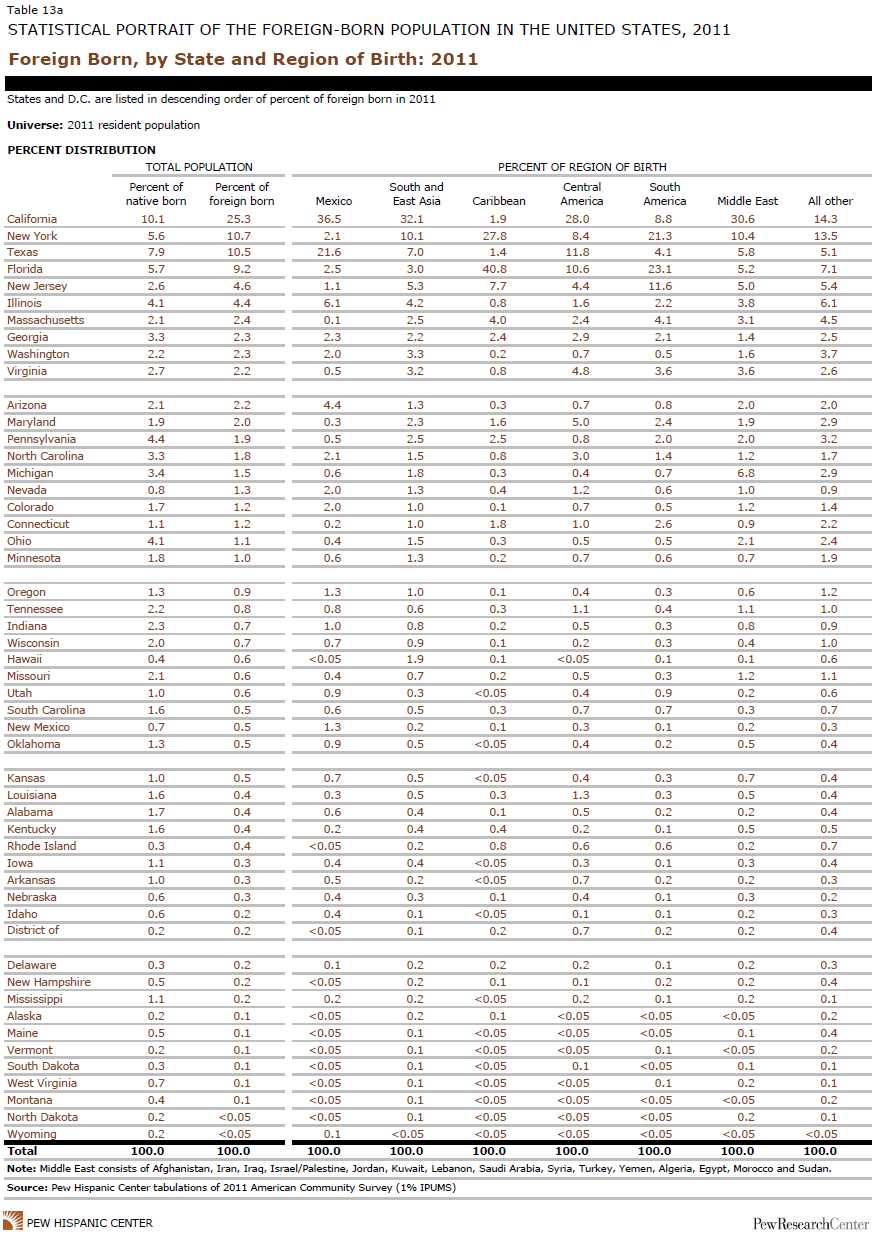
- Foreign Born, by State and Region of Birth: 2011
- Foreign Born, by State and Region of Birth: 2011
- Marital Status, by Region of Birth: 2011
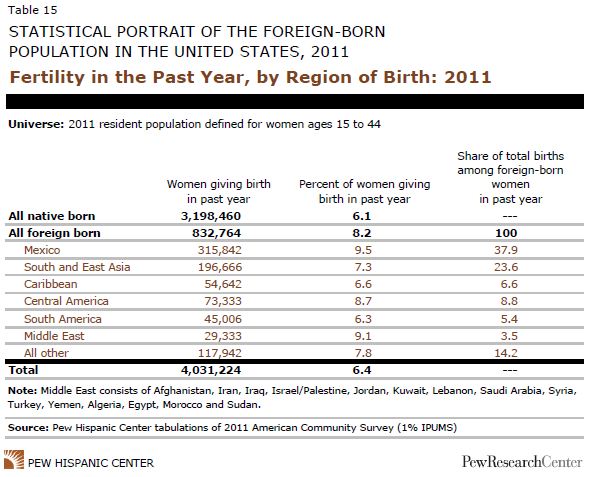
- Fertility in the Past Year, by Region of Birth: 2011
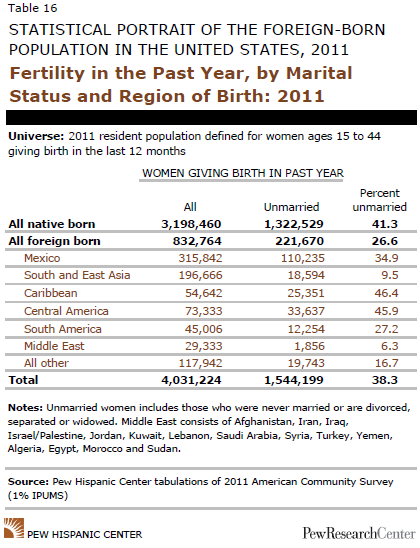
- Fertility in the Past Year, by Marital Status and Region of Birth: 2011
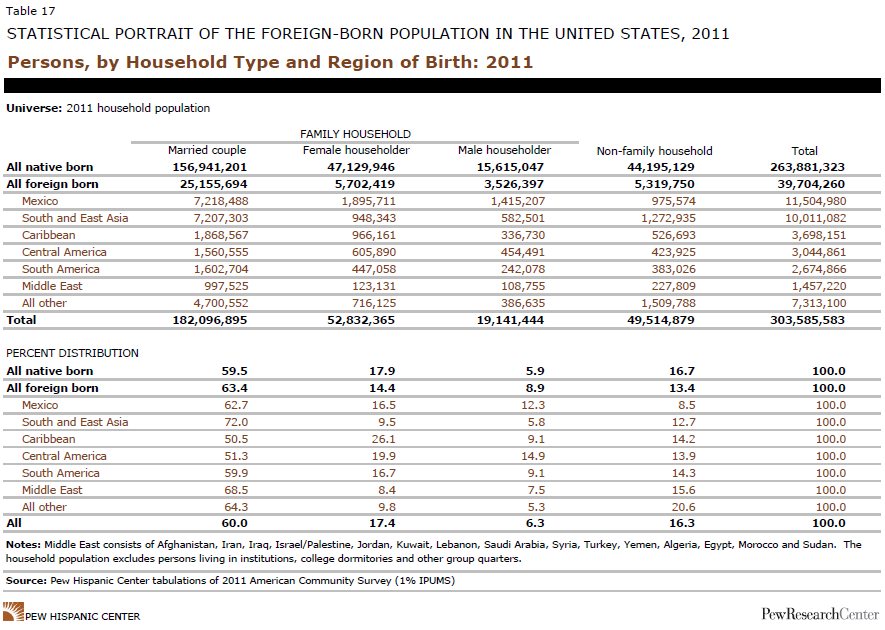
- Persons, by Household Type and Region of Birth: 2011
- Households, by Type and Region of Birth: 2011
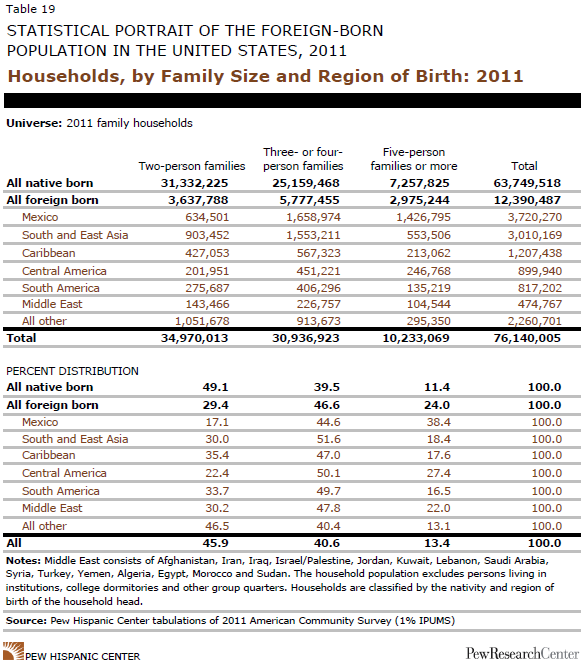
- Households, by Family Size and Region of Birth: 2011
- Living Arrangements of Children, by Region of Birth: 2011
- Language Spoken at Home and English-Speaking Ability, by Age and Region of Birth: 2011
- Language Spoken at Home and English-Speaking Ability Among Foreign Born, by Date of Arrival and Age: 2011
- Persons, by Educational Attainment and Region of Birth: 2011
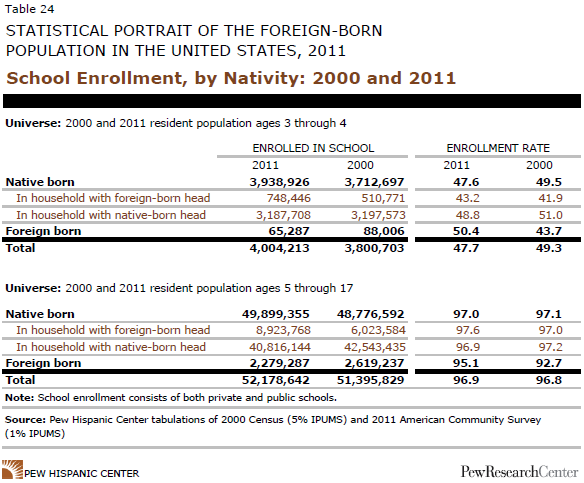
- School Enrollment, by Nativity: 2000 and 2011
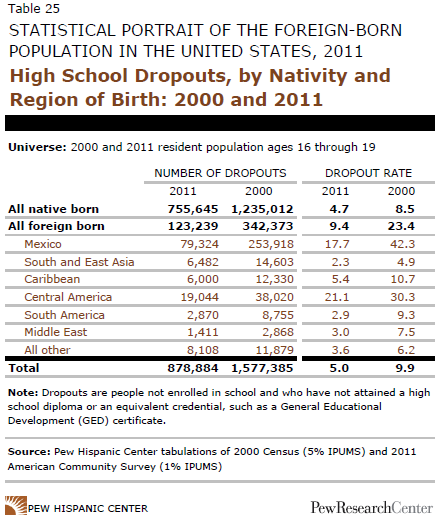
- High School Dropouts, by Nativity and Region of Birth: 2000 and 2011
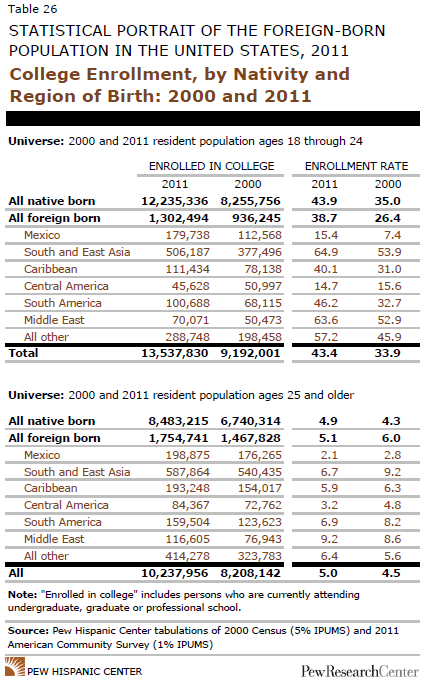
- College Enrollment, by Nativity and Region of Birth: 2000 and 2011
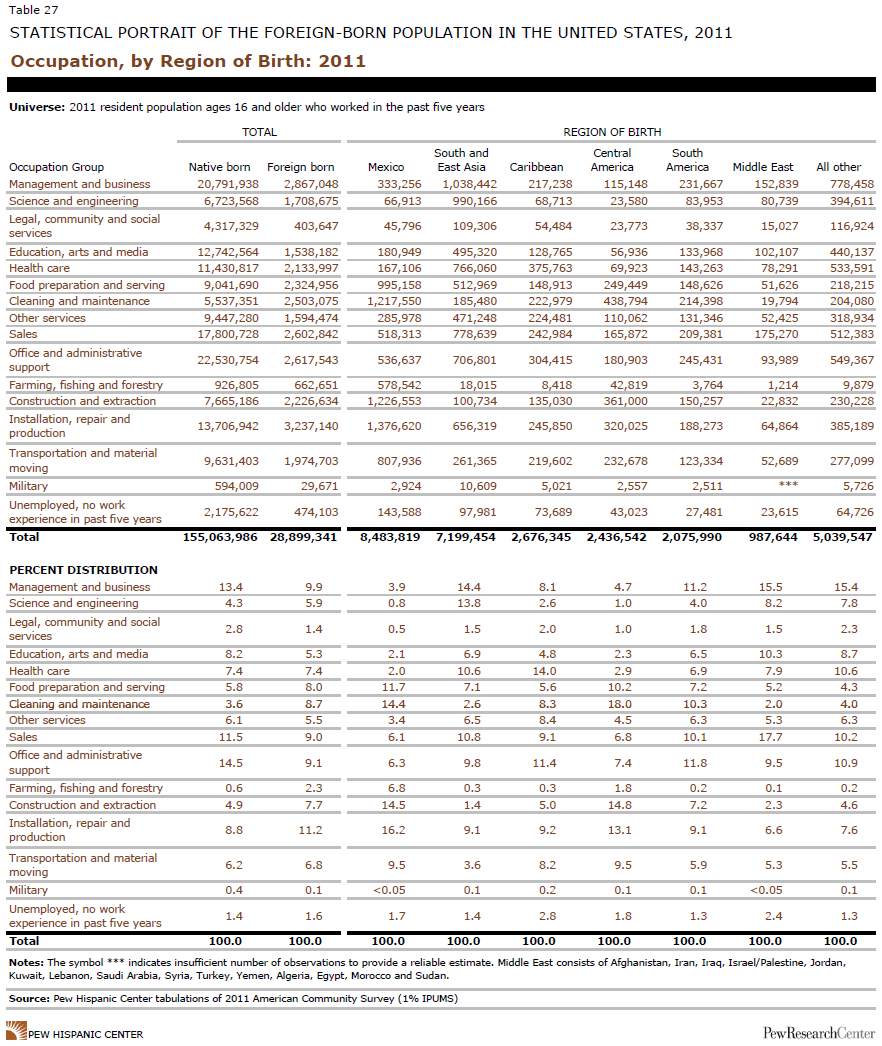
- Occupation, by Region of Birth: 2011
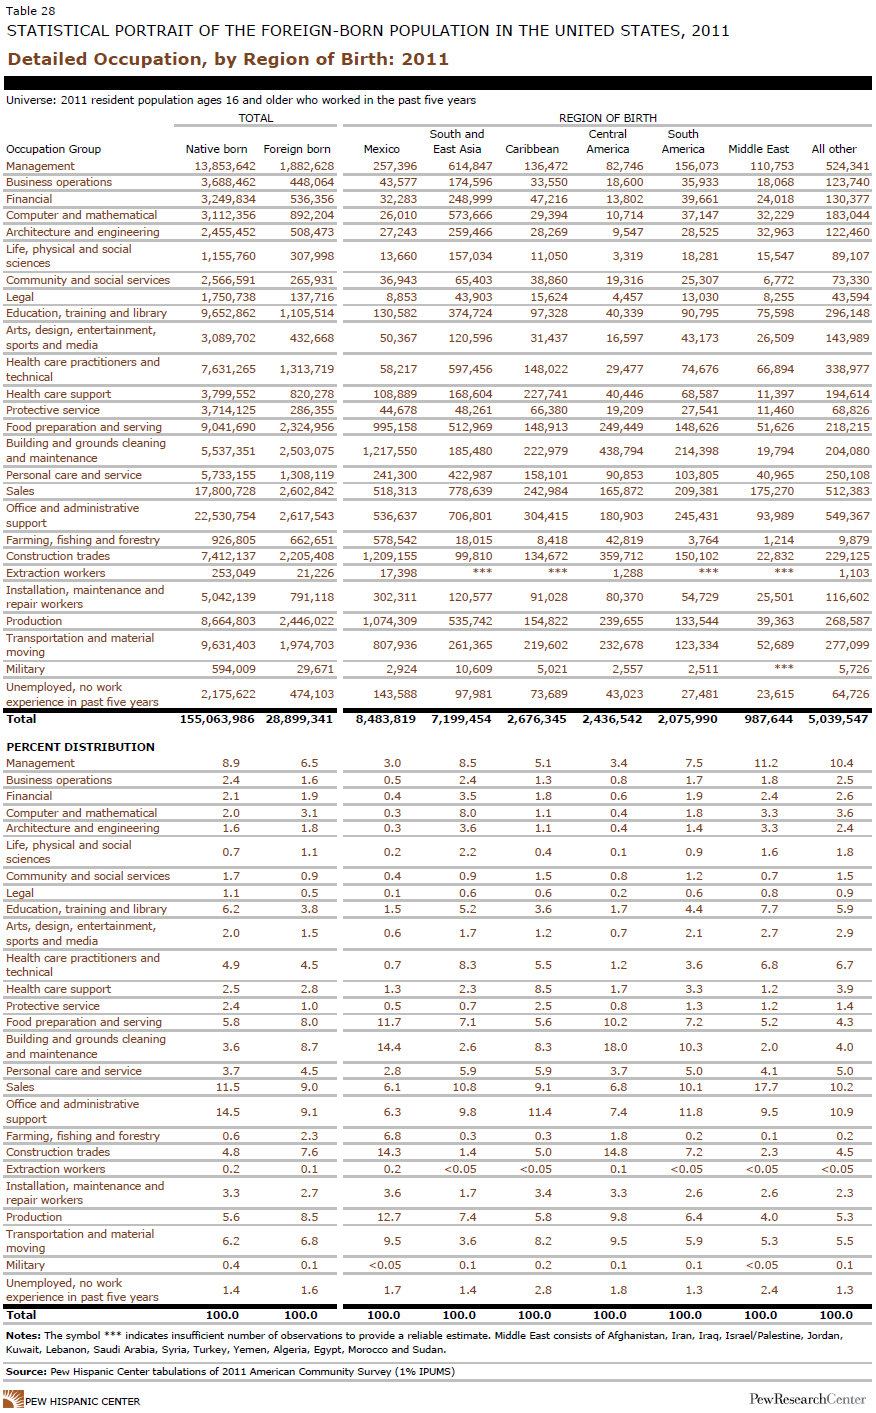
- Detailed Occupation, by Region of Birth: 2011
- Industry, by Region of Birth: 2011
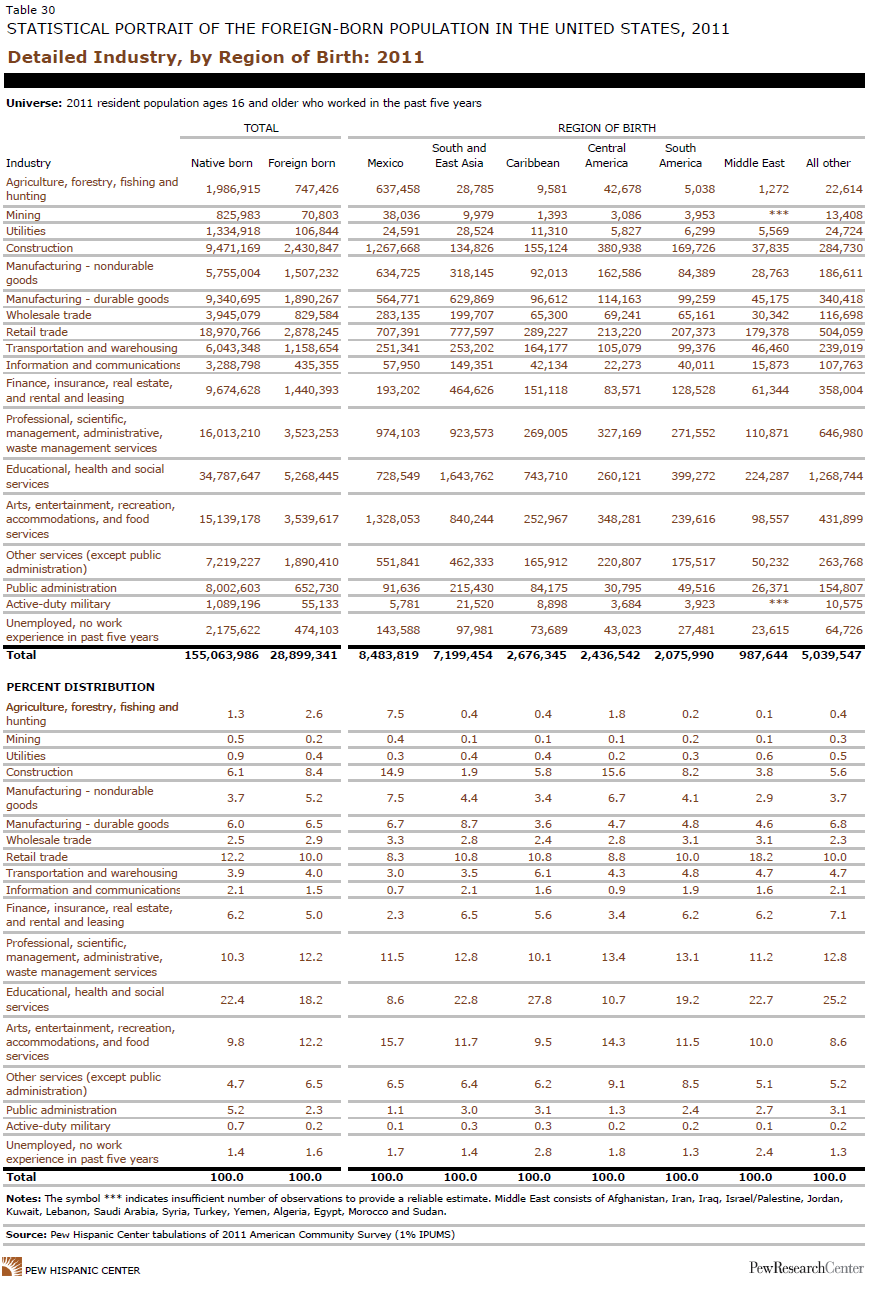
- Detailed Industry, by Region of Birth: 2011
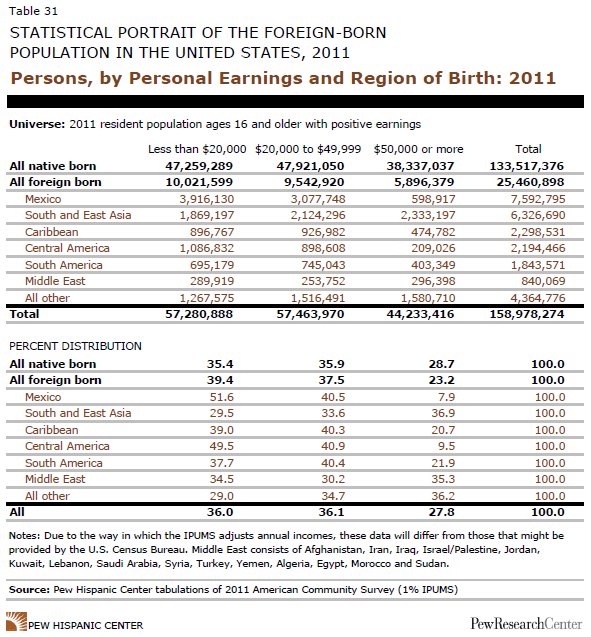
- Persons, by Personal Earnings and Region of Birth: 2011
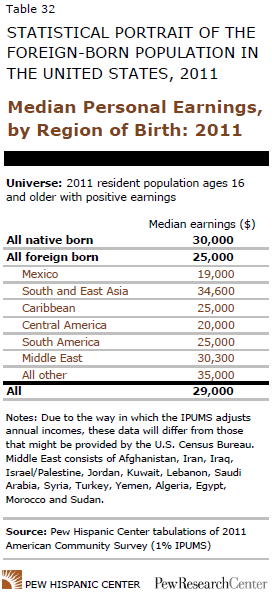
- Median Personal Earnings, by Region of Birth: 2011
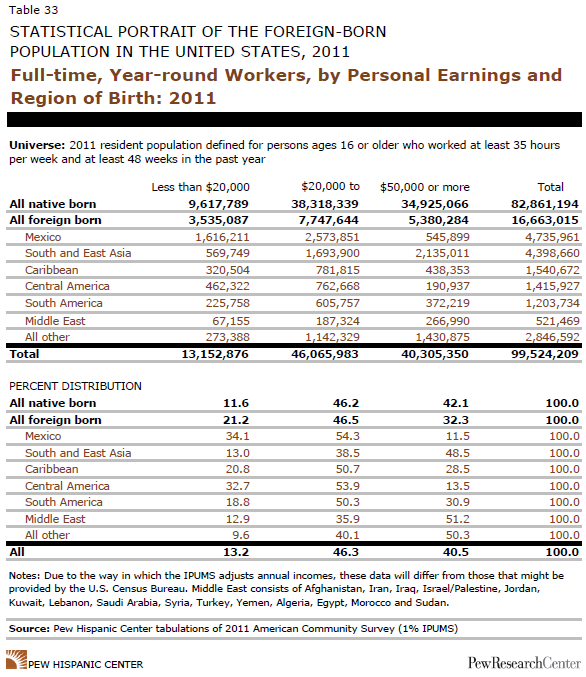
- Full-time, Year-round Workers, by Personal Earnings and Region of Birth: 2011
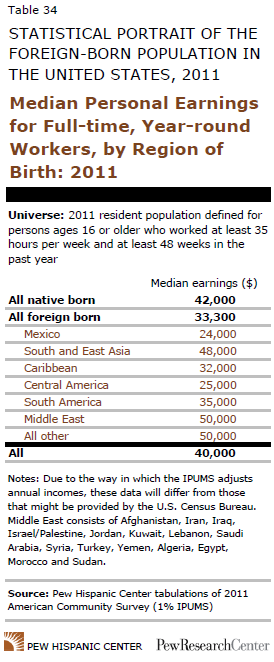
- Median Personal Earnings for Full-time, Year-round Workers, by Region of Birth: 2011
- Households, by Income and Region of Birth: 2011
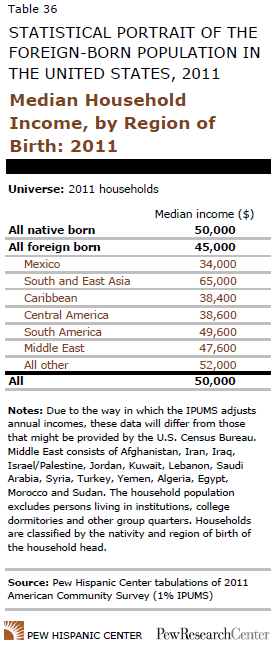
- Median Household Income, by Region of Birth: 2011
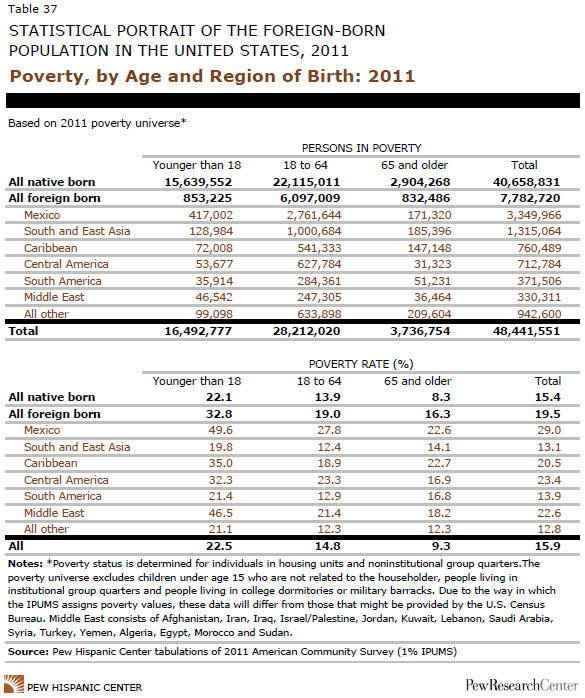
- Poverty, by Age and Region of Birth: 2011
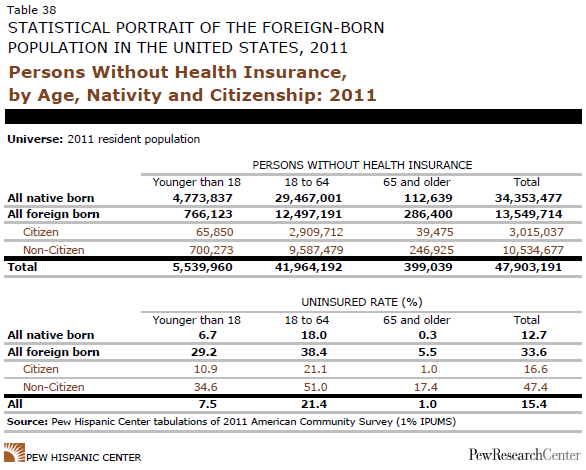
- Persons Without Health Insurance, by Age, Nativity and Citizenship: 2011
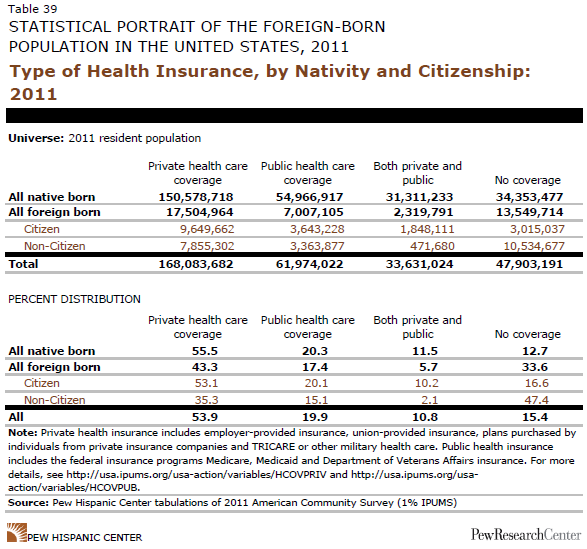
- Type of Health Insurance, by Nativity and Citizenship: 2011
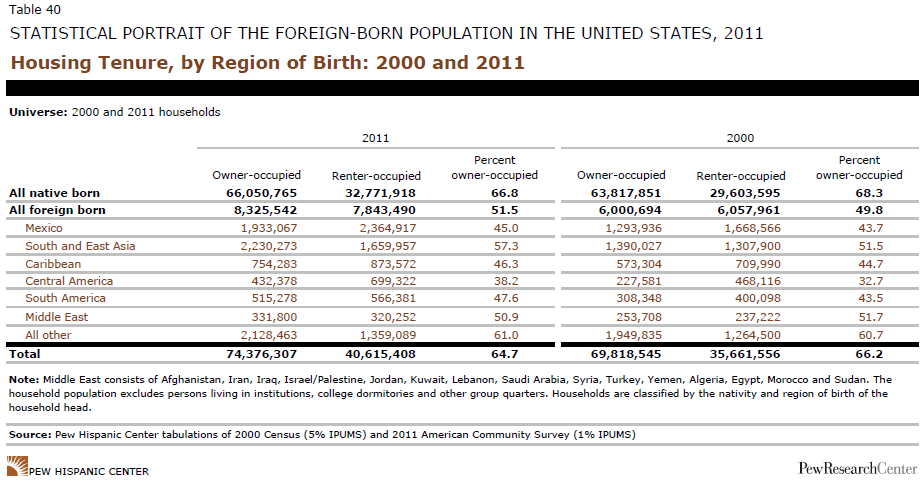
- Housing Tenure, by Region of Birth: 2000 and 2011
- Homeownership Among Foreign-Born Heads of Households, by Date of Arrival: 2011
Click image to print | Back to top
Click image to print | Back to top
Click image to print | Back to top
Click image to print | Back to top
Click image to print | Back to top
Click image to print | Back to top
Click image to print | Back to top
Click image to print | Back to top
Click image to print | Back to top

Click image to print | Back to top

Click image to print | Back to top

Click image to print | Back to top
Click image to print | Back to top
Click image to print | Back to top
Click image to print | Back to top

Click image to print | Back to top
Click image to print | Back to top
Click image to print | Back to top
Click image to print | Back to top

Click image to print | Back to top
Click image to print | Back to top

Click image to print | Back to top

Click image to print | Back to top

Click image to print | Back to top

Click image to print | Back to top
Click image to print | Back to top
Click image to print | Back to top
Click image to print | Back to top
Click image to print | Back to top
Click image to print | Back to top

Click image to print | Back to top
Click image to print | Back to top
Click image to print | Back to top
Click image to print | Back to top
Click image to print | Back to top
Click image to print | Back to top

Click image to print | Back to top
Click image to print | Back to top
Click image to print | Back to top
Click image to print | Back to top
Click image to print | Back to top
Click image to print | Back to top

Click image to print | Back to top
