This statistical profile provides key demographic information of Latino eligible voters in Maryland.1 It also contains data on other major groups of eligible voters in Maryland.2 All data are based on Pew Hispanic Center tabulations of the Census Bureau’s 2008 American Community Survey.3
Hispanics in Maryland’s Eligible Voter Population
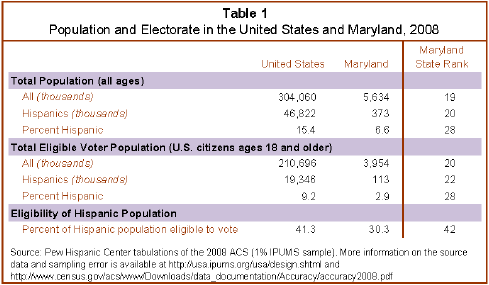
- The Hispanic population in Maryland is the 20th-largest in the nation. Some 373,000 Hispanics reside in Maryland.
- The population in Maryland is 7% Hispanic, the 28th-highest Hispanic population share nationally.
- There are 113,000 eligible Hispanic voters in Maryland—the 22nd-largest Hispanic eligible-voter population nationally. California ranks first with 5.4 million.
- Some 3% of eligible voters in Maryland are Latinos, the 28th-largest Hispanic eligible voter population share nationally. New Mexico ranks first with 38%.
- Three-in-ten (30%) of Latinos in Maryland are eligible to vote, ranking Maryland 42nd nationwide in the share of the Hispanic population that is eligible to vote. In contrast, 78% of the state’s white population is eligible to vote.
Characteristics of Eligible Voters
- Age. One-third of Hispanic eligible voters in Maryland (33%) are ages 18 to 29, greater than the share of all Latino eligible voters nationwide (31%) in that age range. By contrast, only 23% of all Maryland eligible voters and 22% of all U.S. eligible voters are ages 18 to 29.
- Citizenship. Some 43% of Hispanic eligible voters in Maryland are naturalized U.S. citizens, compared with 8% of all Maryland eligible voters. Hispanic eligible voters in Maryland are less likely to be native-born citizens (57%) than are Hispanic eligible voters nationwide (74%).
- Educational Attainment. Two-in-ten of Latino eligible voters in Maryland (18%) have not completed high school. That was less than to the rate for all Latino eligible voters—26%—but greater than the rate for U.S. eligible voters nationwide—13%.
- Homeownership. Seven-in-ten of Hispanic eligible voters in Maryland (70%) live in owner-occupied homes, compared with 60% of all Hispanic eligible voters nationwide. Similar shares of all eligible voters in Maryland (72%) and eligible voters nationwide (70%) live in owner-occupied homes.

Characteristics of Eligible Voters in Maryland, by Race and Ethnicity
- Number of Latino Eligible Voters. Latino eligible voters are outnumbered by white eligible voters in Maryland by more than 22 to 1—113,000 Latinos to 2.5 million whites.
- Age. Latino eligible voters are younger than other major racial groups in Maryland. One-in-four Latino eligible voters in Maryland (26%) are ages 18 to 29 compared with 24% of black eligible voters, 20% of Asian eligible voters and 19% of white eligible voters.
- Educational Attainment. Hispanic eligible voters have lower levels of education than do white and black eligible voters in Maryland. Some 18% of Hispanic eligible voters have not obtained at least a high school diploma compared with 15% of black eligible voters and 9% of white eligible voters.
- Homeownership. Hispanic eligible voters in Maryland are less likely than white eligible voters, but more likely than black eligible voters, to live in owner-occupied homes—70% versus 78% and 58%, respectively.


