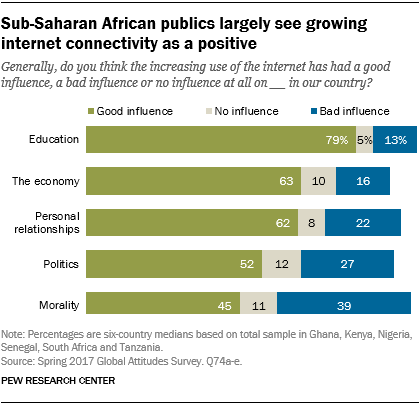
 Sub-Saharan Africa has experienced dramatic gains in internet use in recent years. With this rapid growth in connectivity have come a host of potential problems, including fake news, political targeting and manipulation and financial scams, among others. Yet according to a new Pew Research Center analysis, most sub-Saharan Africans feel positively about the role the internet plays in their country. Large majorities say the increasing use of the internet has had a good influence on education in their country, and half or more say the same about the economy, personal relationships and politics.
Only when it comes to the issue of morality are sub-Saharan Africans somewhat more divided about the role the internet is playing. Across six major nations surveyed in the region, a median of 45% say the internet has had a positive impact on morality, while 39% say it is has been negative. These views vary substantially by country. For example, a majority of Nigerians (57%) believe the internet is having a good influence on morality, while more than half of Senegalese (54%) say the opposite.
Still, in some countries, evaluations of how the internet affects morality have improved since 2014. In Ghana today, 42% think that growing internet use has a positive effect on morality – up from 29% in 2014. Favorable assessments of the internet’s impact on economics and politics have risen even more over the same time period. For example, in 2017, around two-thirds of Nigerians (64%) said the increasing use of the internet had a positive influence on their country’s politics, compared with just 43% in 2014.
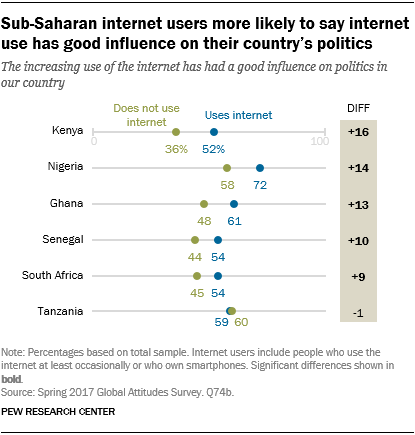 Generally, internet users –meaning people who say they use the internet or own an internet-connected smartphone – are more positive about its influence. For example, in all countries but Tanzania, internet users are more likely to think the internet plays a positive role in the country’s politics.
In most countries, these gaps in attitudes between internet haves and have-nots persist whether looking at issues of morality, education, or even the economy. For instance, 72% of Ghanaian internet users see economic benefits stemming from greater connectivity, compared with 54% of non-users, and the pattern is the same in Kenya, South Africa and Nigeria.
These are among the major findings of a Pew Research Center survey conducted in six sub-Saharan African countries from Feb. 21 to April 28, 2017, among 6,795 respondents.
The survey also finds that sub-Saharan Africans primarily use the internet and their mobile phones for social and entertainment purposes, though many also use their mobile devices for sending and receiving payments. Still, people are more likely to engage in nearly all activities – even basic ones like texting – if they have smartphones, suggesting the emergence of a new digital divide based on phone type. The survey also highlights long-standing digital divides along demographic lines: Higher-income, more-educated and younger people are consistently more likely to use the internet, own a smartphone and engage in social networking.
Internet use increases across sub-Saharan Africa; share with a smartphone doubles
Globally, internet use is much more common in wealthier countries. The percentage of people who are online in each country is highly correlated with countries’ gross domestic product per capita (PPP). Regionally, internet use is lowest in sub-Saharan Africa, where a median of 41% across six countries use the internet. South Africa (59%) is the only country in the region where at least half the population is online.
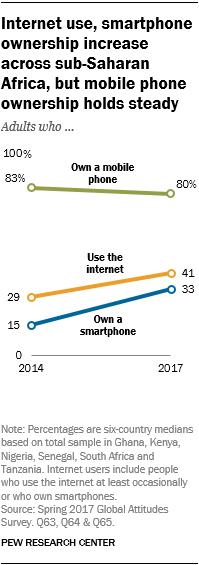
Still, the gap in internet use between emerging and advanced economies has narrowed. Whereas internet use in many of the world’s advanced economies has plateaued in recent years, use in sub-Saharan Africa has notably increased. In 2014, 15% of sub-Saharan Africans owned a smartphone, compared with 33% who own one today. The number of people connected to the internet is likely to continue to rise, too; industry projections suggest that the smartphone adoption rate in sub-Saharan Africa will double by 2025.
Socializing is the most popular form of internet activity
 As people across the region get online, new opportunities emerge to use the internet for education, for business or to communicate with their social networks.
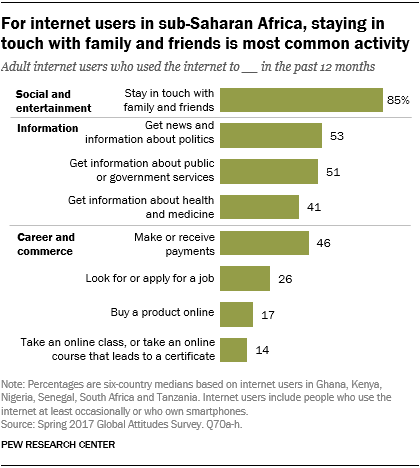
Sub-Saharan Africans are far-and-away most likely to use the internet for this last purpose: staying in touch with their family and friends. More than eight-in-ten internet users say they have used the internet for this purpose over the past year.
While less common than keeping in touch with the people in their lives, around half of online sub-Saharan Africans use the internet to get news and information about politics (median of 53% of internet users) or public or government services (51%). Another four-in-ten use it to access information about health and medicine (41%).
Comparatively few people have used the internet in the past year to look or apply for a job (26%) or to take an online class (14%). Even online shopping – a very common activity in the U.S. – remains somewhat limited in sub-Saharan Africa (17%).
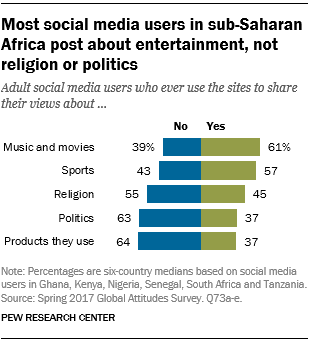
On social media, too, most people are gravitating toward social activities over political, religious or commercial ones. Among the minority of sub-Saharan Africans who use social media (ranging from 43% in South Africa to 20% in Tanzania), more say they share their views on entertainment-related topics like music, movies and sports than say they post about politics, religion or products they enjoy.
On phones, focus is entertainment, mobile payments
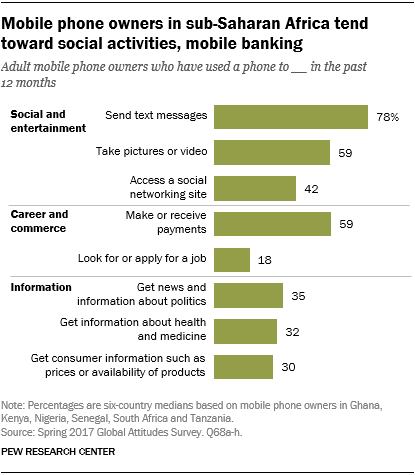 Sub-Saharan Africans are more likely to use their mobile devices – whether smartphones or not – for social and entertainment purposes than for information-seeking or career- and commerce-related activities. Across the region, a majority of phone owners are using their devices to send text messages and to take pictures or video. Around four-in-ten phone owners also use their mobile phones to access social networking sites.
Another very popular phone-based activity is making or receiving payments. Around six-in-ten mobile phone owners have used their devices for this type of online banking over the past year, ranging from a high of 83% in Kenya (where M-Pesa is a dominant force) to a low of 34% in Nigeria.
Outside of banking, though, relatively few people use their phones for other career and commerce activities, like looking for or applying for jobs. Information-seeking activities are also less popular: Only around a third of mobile phone owners say they have used their mobile device over the past year to get news and information about politics, health or prices and products.
Phone type heavily shapes what people do on their devices
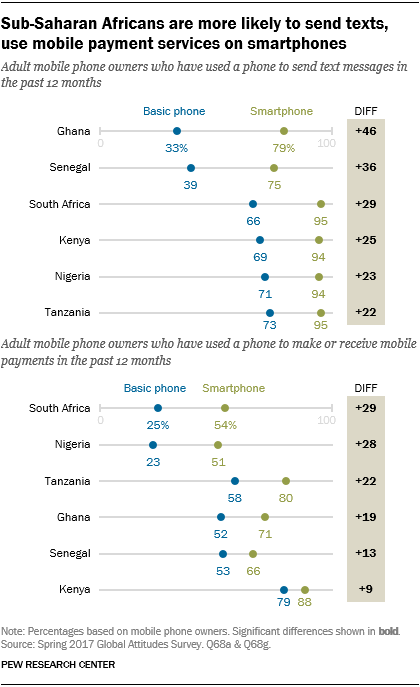 Social activities and sending and receiving money are some of the most common mobile phone-based activities because they can be done both from a basic phone – one that does not connect to the internet – or from a smartphone. But even though they can be done at equal rates, people with smartphones are much more likely to use their phones for these types of activities.
Take, for example, sending text messages. Those who have mobile devices that connect to the internet are much more likely to text their network than those with a basic phone. In Ghana, the difference is particularly stark: 79% of smartphone users have texted over the past year, compared with only a third of basic phone users.
Similarly, while mobile phones are a very important tool for helping poorer people gain access to needed financial services, people are much more likely to use their phones to make or receive payments if they are internet-enabled. For example, in South Africa, more than half of those who have smartphones use their phones for mobile payments, whereas only a quarter of those with basic phones do the same.
Smartphone users and basic phone users also differ in other key ways. People who are more educated, more affluent and younger are more likely to use smartphones than others. Smartphone users are also more likely to say the internet is having a positive impact on society.
Comparing phone ownership and technology use in sub-Saharan Africa with other regions
The interactive below provides data for levels of internet use, overall mobile phone ownership, smartphone ownership and social media use over time. All figures are based on total sample and include all data available for each year. You can sort the data by year or by country, and compare how the six sub-Saharan African countries highlighted in this report compare with other countries around the world.
Compare Africa’s rates of internet use, mobile phone ownership, smartphone ownership and social media use with other countries around the globe
% of adults who use the internet at least occasionally or own a smartphone
(Countries surveyed in Africa are highlighted in green)
| Country | 2013 | 2014 | 2015 | 2016 | 2017 |
|---|---|---|---|---|---|
| United States | 84 | 84 | 86 | 88 | 89 |
| Canada | — | — | 90 | 91 | 91 |
| France | — | — | 75 | 81 | 87 |
| Germany | — | — | 85 | 85 | 87 |
| Greece | — | — | — | 60 | 66 |
| Hungary | — | — | — | 66 | 74 |
| Italy | — | — | 72 | 71 | 71 |
| Netherlands | — | — | — | 95 | 93 |
| Poland | 63 | 63 | 69 | 73 | 75 |
| Spain | — | — | 87 | 90 | 87 |
| Sweden | — | — | — | 93 | 92 |
| United Kingdom | — | — | 88 | 89 | 88 |
| Russia | 66 | 73 | 72 | — | 78 |
| Australia | — | — | 93 | 93 | 93 |
| China | 55 | 63 | 65 | 71 | — |
| India | 16 | 20 | 22 | 21 | 25 |
| Indonesia | 23 | 24 | 30 | — | 30 |
| Japan | — | — | 69 | 72 | 76 |
| Philippines | 34 | 42 | 40 | — | 56 |
| South Korea | — | — | 94 | — | 96 |
| Vietnam | — | 43 | 50 | — | 64 |
| Israel | — | — | 86 | — | 88 |
| Jordan | 47 | 47 | 67 | — | 80 |
| Lebanon | 57 | 62 | 66 | — | 83 |
| Tunisia | 40 | 42 | — | — | 44 |
| Turkey | 41 | — | 72 | — | 76 |
| Ghana | 26 | 21 | 25 | — | 39 |
| Kenya | 37 | 29 | 40 | — | 39 |
| Nigeria | 33 | 39 | 39 | — | 42 |
| Senegal | 34 | 28 | 31 | — | 46 |
| South Africa | 43 | 41 | 42 | — | 59 |
| Tanzania | — | 19 | 21 | — | 25 |
| Argentina | 68 | 62 | 71 | — | 78 |
| Brazil | 49 | 51 | 60 | — | 70 |
| Chile | 66 | 76 | 78 | — | 78 |
| Colombia | — | 57 | — | — | 75 |
| Mexico | 45 | 50 | 54 | — | 67 |
| Peru | — | 46 | 52 | — | 64 |
| Venezuela | 59 | 67 | 67 | — | 72 |
Note: “–” indicates data not available for this year. Internet use is based on individuals who report either using the internet occasionally or owning a smartphone. Percentages are based on total sample.
Source: Spring 2017 Global Attitudes Survey. Q63, Q64, Q65 & Q71. U.S. data from a Pew Research Center survey conducted Jan. 3-10, 2018. China data from Spring 2016 Global Attitudes Survey.
% of adults who use online social networking sites
(Countries surveyed in Africa are highlighted in green)
| Country | 2013 | 2014 | 2015 | 2016 | 2017 |
|---|---|---|---|---|---|
| United States | 61 | 62 | 65 | 69 | 69 |
| Canada | — | — | 66 | 65 | 68 |
| France | — | — | 43 | 48 | 53 |
| Germany | — | — | 42 | 37 | 40 |
| Greece | — | — | — | 46 | 45 |
| Hungary | — | — | — | 53 | 56 |
| Italy | — | — | 47 | 53 | 48 |
| Netherlands | — | — | — | 70 | 61 |
| Poland | 43 | 39 | 46 | 50 | 46 |
| Spain | — | — | 57 | 63 | 59 |
| Sweden | — | — | — | 71 | 67 |
| United Kingdom | — | — | 58 | 61 | 60 |
| Russia | 57 | 62 | 61 | — | 66 |
| Australia | — | — | 65 | 70 | 69 |
| China | 26 | 37 | 41 | 60 | — |
| India | 8 | 13 | 14 | 14 | 20 |
| Indonesia | 19 | 21 | 26 | — | 26 |
| Japan | — | — | 36 | 43 | 39 |
| Philippines | 30 | 39 | 35 | — | 49 |
| South Korea | — | — | 51 | — | 69 |
| Vietnam | — | 34 | 38 | — | 53 |
| Israel | — | — | 65 | — | 68 |
| Jordan | 40 | 39 | 60 | — | 75 |
| Lebanon | 41 | 42 | 49 | — | 72 |
| Tunisia | 34 | 37 | — | — | 38 |
| Turkey | 32 | — | 62 | — | 63 |
| Ghana | 20 | 15 | 20 | — | 32 |
| Kenya | 28 | 26 | 32 | — | 30 |
| Nigeria | 28 | 32 | 33 | — | 35 |
| Senegal | 25 | 24 | 23 | — | 35 |
| South Africa | 27 | 30 | 31 | — | 43 |
| Tanzania | — | 15 | 17 | — | 20 |
| Argentina | 51 | 52 | 59 | — | 65 |
| Brazil | 36 | 42 | 48 | — | 53 |
| Chile | 50 | 66 | 66 | — | 63 |
| Colombia | — | 46 | — | — | 61 |
| Mexico | 35 | 41 | 44 | — | 53 |
| Peru | — | 39 | 42 | — | 53 |
| Venezuela | 49 | 59 | 59 | — | 59 |
Note: “–” indicates data not available for this year. Internet use is based on individuals who report either using the internet occasionally or owning a smartphone. Percentages are based on total sample.
Source: Spring 2017 Global Attitudes Survey. Q63, Q64, Q65 & Q71. U.S. data from a Pew Research Center survey conducted Jan. 3-10, 2018. China data from Spring 2016 Global Attitudes Survey.
% of adults who own a cellphone
(Countries surveyed in Africa are highlighted in green)
| Country | 2013 | 2014 | 2015 | 2016 | 2017 |
|---|---|---|---|---|---|
| United States | 89 | 89 | 91 | 95 | 95 |
| Canada | 79 | — | 83 | 86 | 83 |
| France | 86 | 85 | 85 | 91 | 93 |
| Germany | 88 | 90 | 94 | 94 | 92 |
| Greece | 88 | 88 | — | 89 | 91 |
| Hungary | — | — | — | 89 | 91 |
| Italy | 92 | 93 | 95 | 89 | 90 |
| Netherlands | — | — | — | 96 | 96 |
| Poland | 84 | 84 | 88 | 89 | 91 |
| Spain | 91 | 91 | 96 | 97 | 97 |
| Sweden | — | — | — | — | 97 |
| United Kingdom | 92 | 92 | 92 | 93 | 93 |
| Russia | 94 | 96 | 96 | — | 96 |
| Australia | 91 | — | 94 | 95 | 94 |
| China | 95 | 97 | 97 | 97 | — |
| India | 77 | 81 | 78 | 72 | 73 |
| Indonesia | 78 | 78 | 77 | — | 75 |
| Japan | 85 | 87 | 89 | 92 | 92 |
| Philippines | 71 | 74 | 70 | — | 74 |
| South Korea | 100 | 100 | 100 | — | 100 |
| Vietnam | — | 82 | 86 | — | 92 |
| Israel | 92 | 93 | 97 | — | 97 |
| Jordan | 95 | 97 | 98 | — | 99 |
| Lebanon | 86 | 85 | 88 | — | 95 |
| Tunisia | 88 | 86 | — | — | 84 |
| Turkey | 87 | — | 95 | — | 96 |
| Ghana | 79 | 83 | 75 | — | 80 |
| Kenya | 82 | 82 | 82 | — | 80 |
| Nigeria | 78 | 89 | 89 | — | 80 |
| Senegal | 81 | 83 | 83 | — | 79 |
| South Africa | 91 | 89 | 89 | — | 91 |
| Tanzania | — | 73 | 73 | — | 75 |
| Argentina | 83 | 82 | 82 | — | 85 |
| Brazil | 80 | 87 | 86 | — | 86 |
| Chile | 91 | 93 | 93 | — | 93 |
| Colombia | — | 89 | — | — | 89 |
| Mexico | 63 | 74 | 72 | — | 75 |
| Peru | — | 77 | 78 | — | 84 |
| Venezuela | — | 88 | 83 | — | 77 |
Note: “–” indicates data not available for this year. Internet use is based on individuals who report either using the internet occasionally or owning a smartphone. Percentages are based on total sample.
Source: Spring 2017 Global Attitudes Survey. Q63, Q64, Q65 & Q71. U.S. data from a Pew Research Center survey conducted Jan. 3-10, 2018. China data from Spring 2016 Global Attitudes Survey.
% of adults who own a smartphone
(Countries surveyed in Africa are highlighted in green)
| Country | 2013 | 2014 | 2015 | 2016 | 2017 |
|---|---|---|---|---|---|
| United States | 56 | 55 | 67 | 72 | 77 |
| Canada | — | — | 67 | 72 | 71 |
| France | — | — | 49 | 58 | 62 |
| Germany | — | — | 60 | 66 | 72 |
| Greece | — | — | — | 46 | 53 |
| Hungary | — | — | — | 49 | 61 |
| Italy | — | — | 60 | 63 | 67 |
| Netherlands | — | — | — | 79 | 80 |
| Poland | 21 | 29 | 41 | 52 | 57 |
| Spain | — | — | 71 | 79 | 79 |
| Sweden | — | — | — | 80 | 80 |
| United Kingdom | — | — | 68 | 72 | 72 |
| Russia | 23 | 33 | 45 | — | 59 |
| Australia | — | — | 77 | 79 | 82 |
| China | 37 | 55 | 58 | 68 | — |
| India | 12 | 14 | 17 | 18 | 22 |
| Indonesia | 11 | 15 | 21 | — | 27 |
| Japan | — | — | 39 | 55 | 59 |
| Philippines | 17 | 20 | 22 | — | 44 |
| South Korea | — | — | 88 | — | 94 |
| Vietnam | — | 24 | 35 | — | 53 |
| Israel | — | — | 74 | — | 83 |
| Jordan | 38 | 41 | 51 | — | 76 |
| Lebanon | 45 | 48 | 52 | — | 80 |
| Tunisia | 12 | 12 | — | — | 27 |
| Turkey | 17 | — | 59 | — | 69 |
| Ghana | 15 | 14 | 21 | — | 35 |
| Kenya | 19 | 15 | 26 | — | 30 |
| Nigeria | 19 | 27 | 28 | — | 32 |
| Senegal | 13 | 15 | 19 | — | 34 |
| South Africa | 33 | 34 | 37 | — | 51 |
| Tanzania | — | 8 | 11 | — | 13 |
| Argentina | 34 | 34 | 48 | — | 65 |
| Brazil | 15 | 24 | 41 | — | 54 |
| Chile | 39 | 58 | 65 | — | 72 |
| Colombia | — | 27 | — | — | 56 |
| Mexico | 21 | 28 | 35 | — | 42 |
| Peru | — | 16 | 25 | — | 41 |
| Venezuela | 31 | 39 | 45 | — | 38 |
Note: “–” indicates data not available for this year. Internet use is based on individuals who report either using the internet occasionally or owning a smartphone. Percentages are based on total sample.
Source: Spring 2017 Global Attitudes Survey. Q63, Q64, Q65 & Q71. U.S. data from a Pew Research Center survey conducted Jan. 3-10, 2018. China data from Spring 2016 Global Attitudes Survey.


 Compare Africa's rates of technology use and phone ownership with other countries around the globe