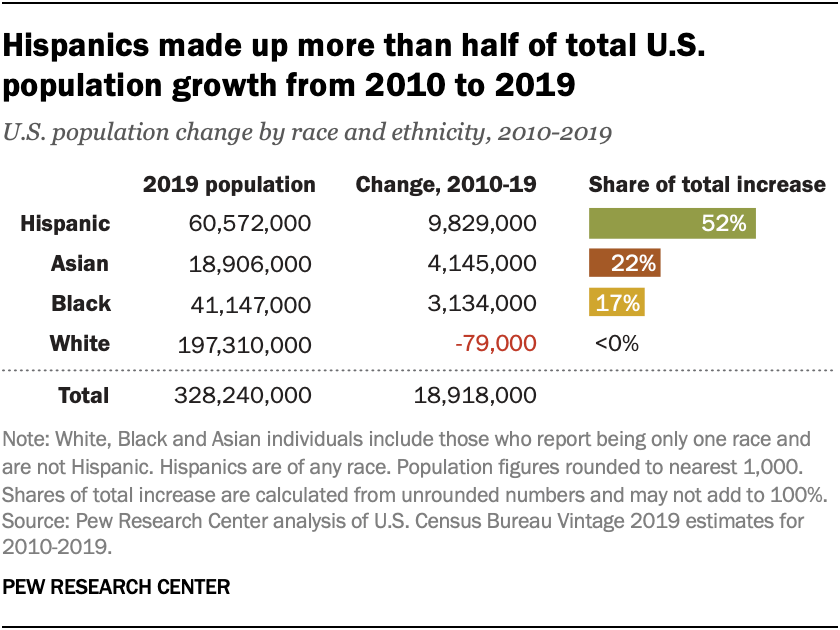
 Hispanics have played a significant role in driving U.S. population growth over the past decade, though the group is not growing as quickly as it once did. From 2010 to 2019, the U.S. population increased by 18.9 million, and Hispanics accounted for more than half (52%) of this growth, according to a Pew Research Center analysis of new U.S. Census Bureau population estimates, the last before 2020 census figures are released.
In 2019, the number of Hispanics reached a record 60.6 million, making up 18% of the U.S. population. This is up from 50.7 million in 2010, when Hispanics were 16% of the population. The number of Hispanics is growing more slowly than it previously did, due to a decline in the annual number of births to Hispanic women and a drop in immigration, particularly from Mexico. From 2015 to 2019, the Hispanic population grew by an average of 1.9% per year, down significantly from a peak of 4.8% from 1995 to 2000.
As part of our ongoing research of Hispanics in the United States, we examined population changes over the past decade of racial and ethnic groups in the U.S., the 50 states and the District of Columbia. The analysis is based on data from the U.S. Census Bureau’s Vintage 2019 population estimates for 2010-2019. These are the last population estimates before the 2020 census.
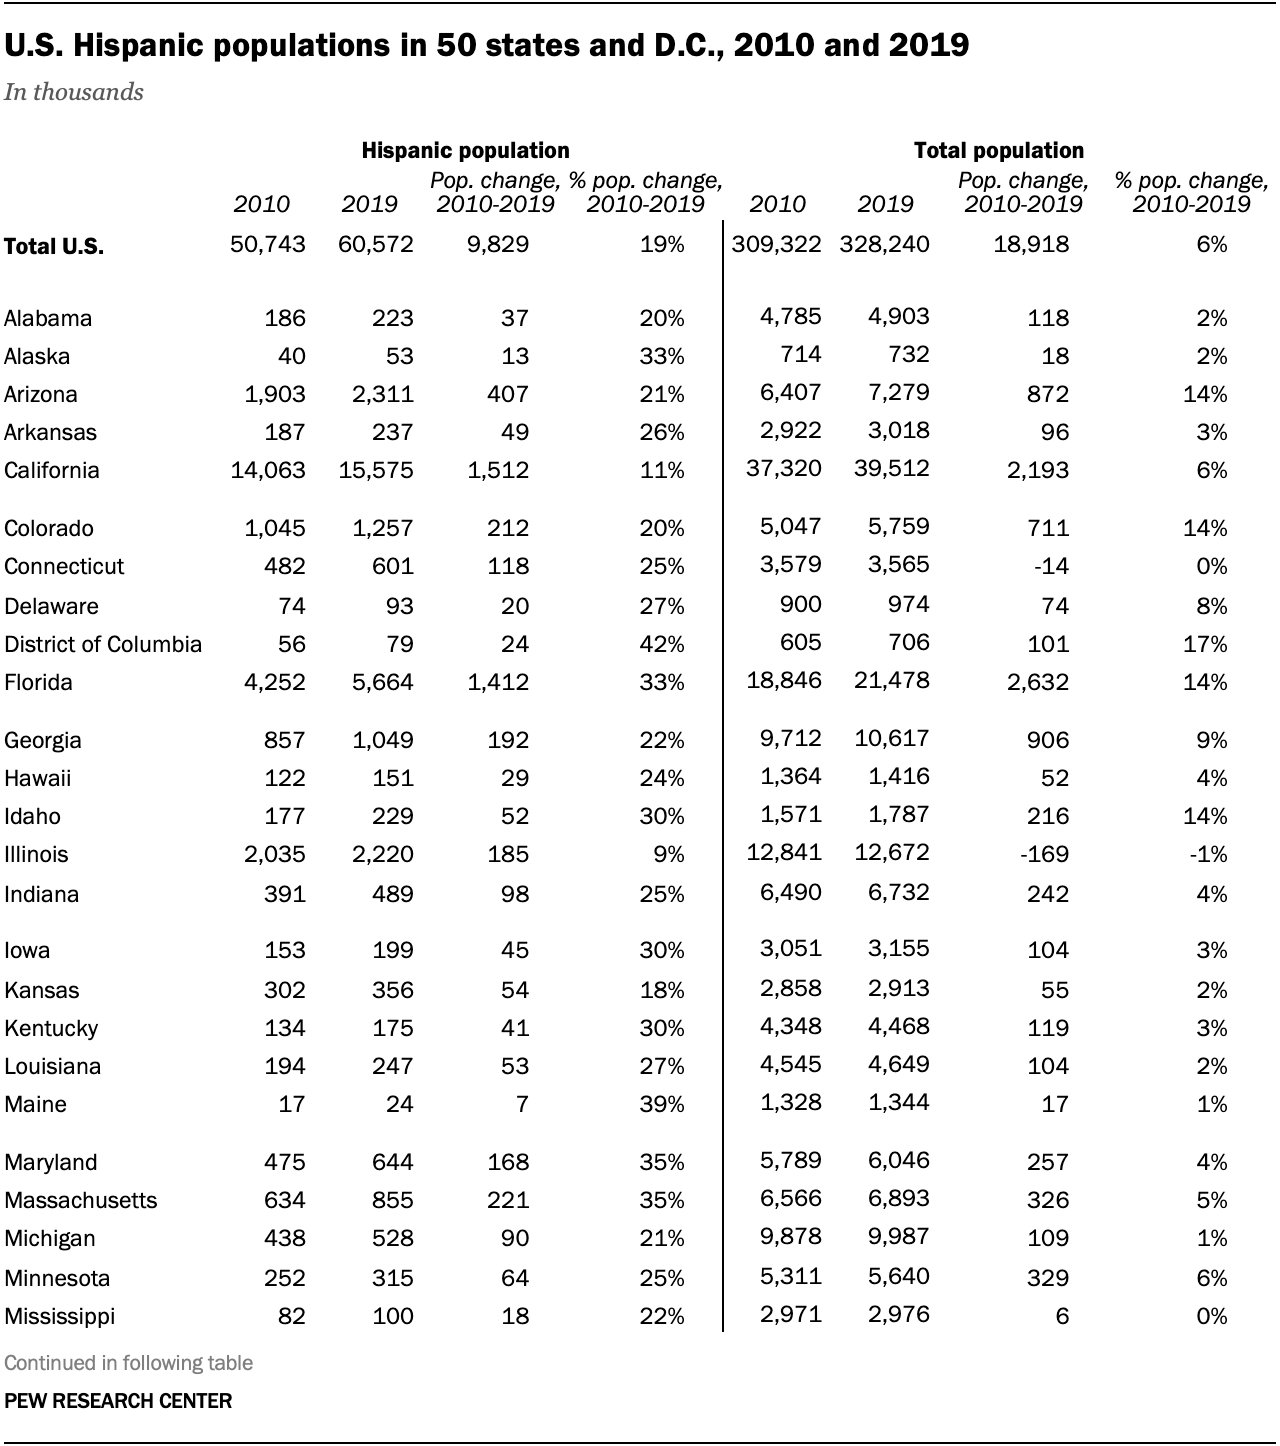
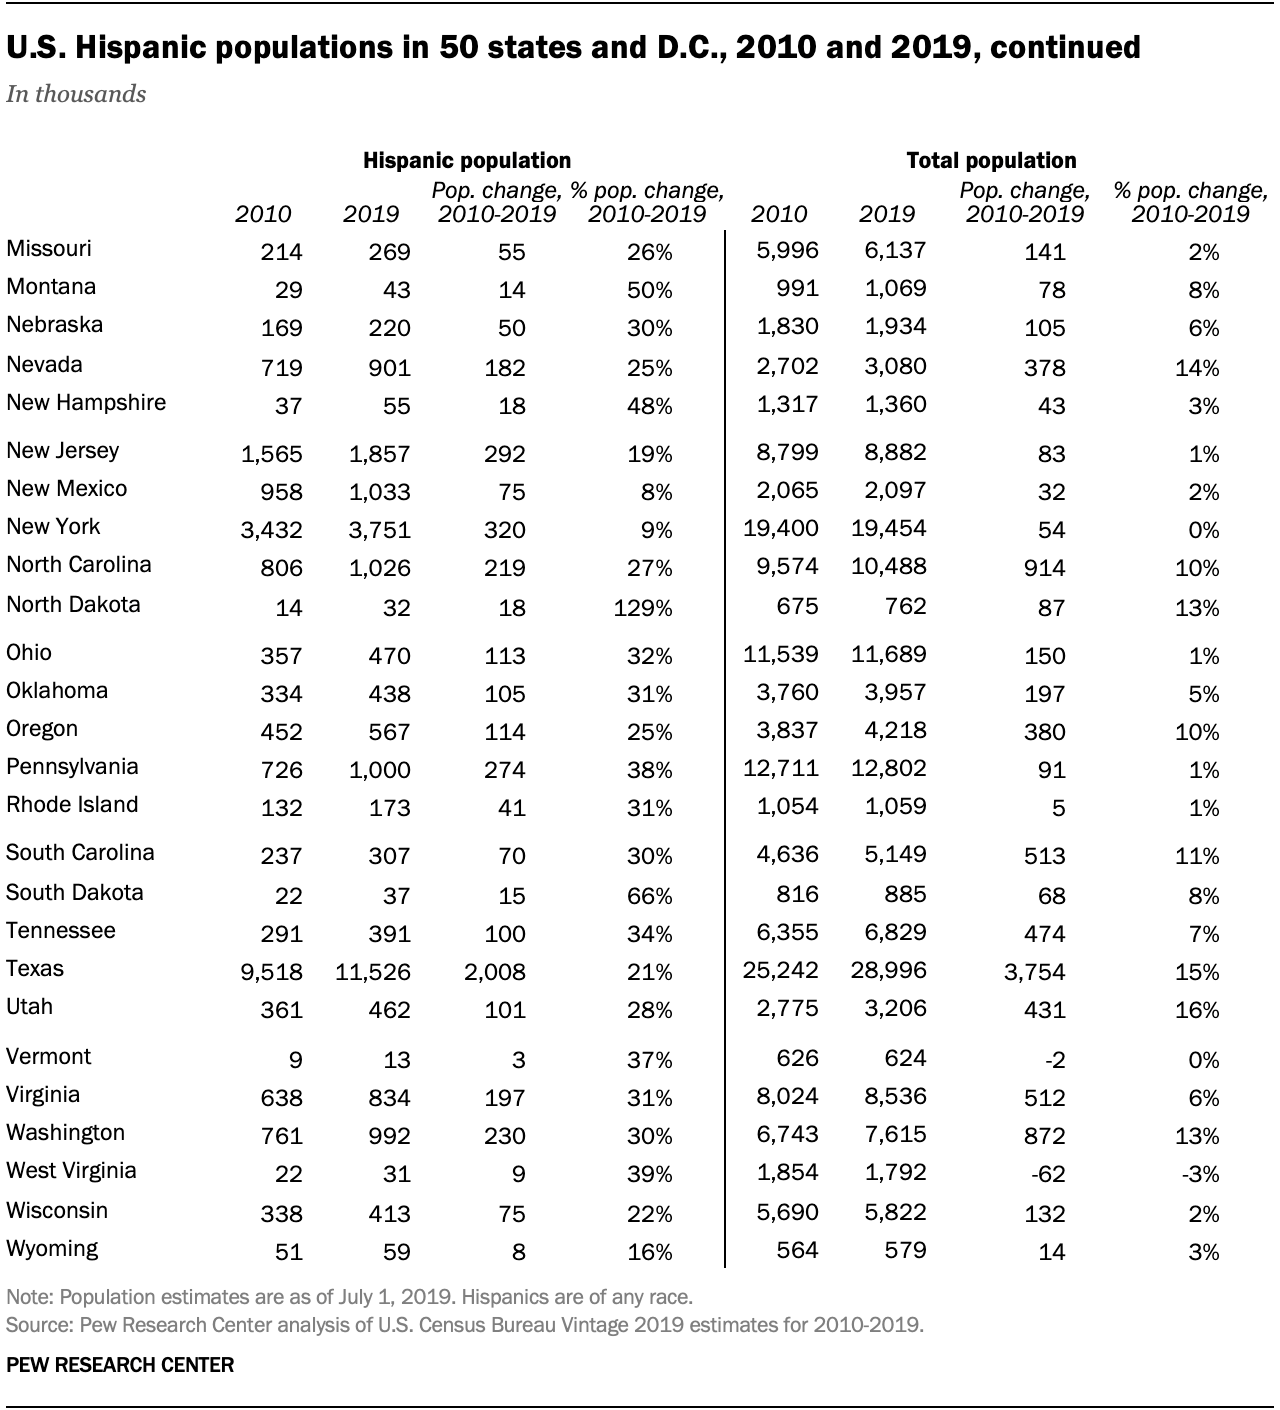
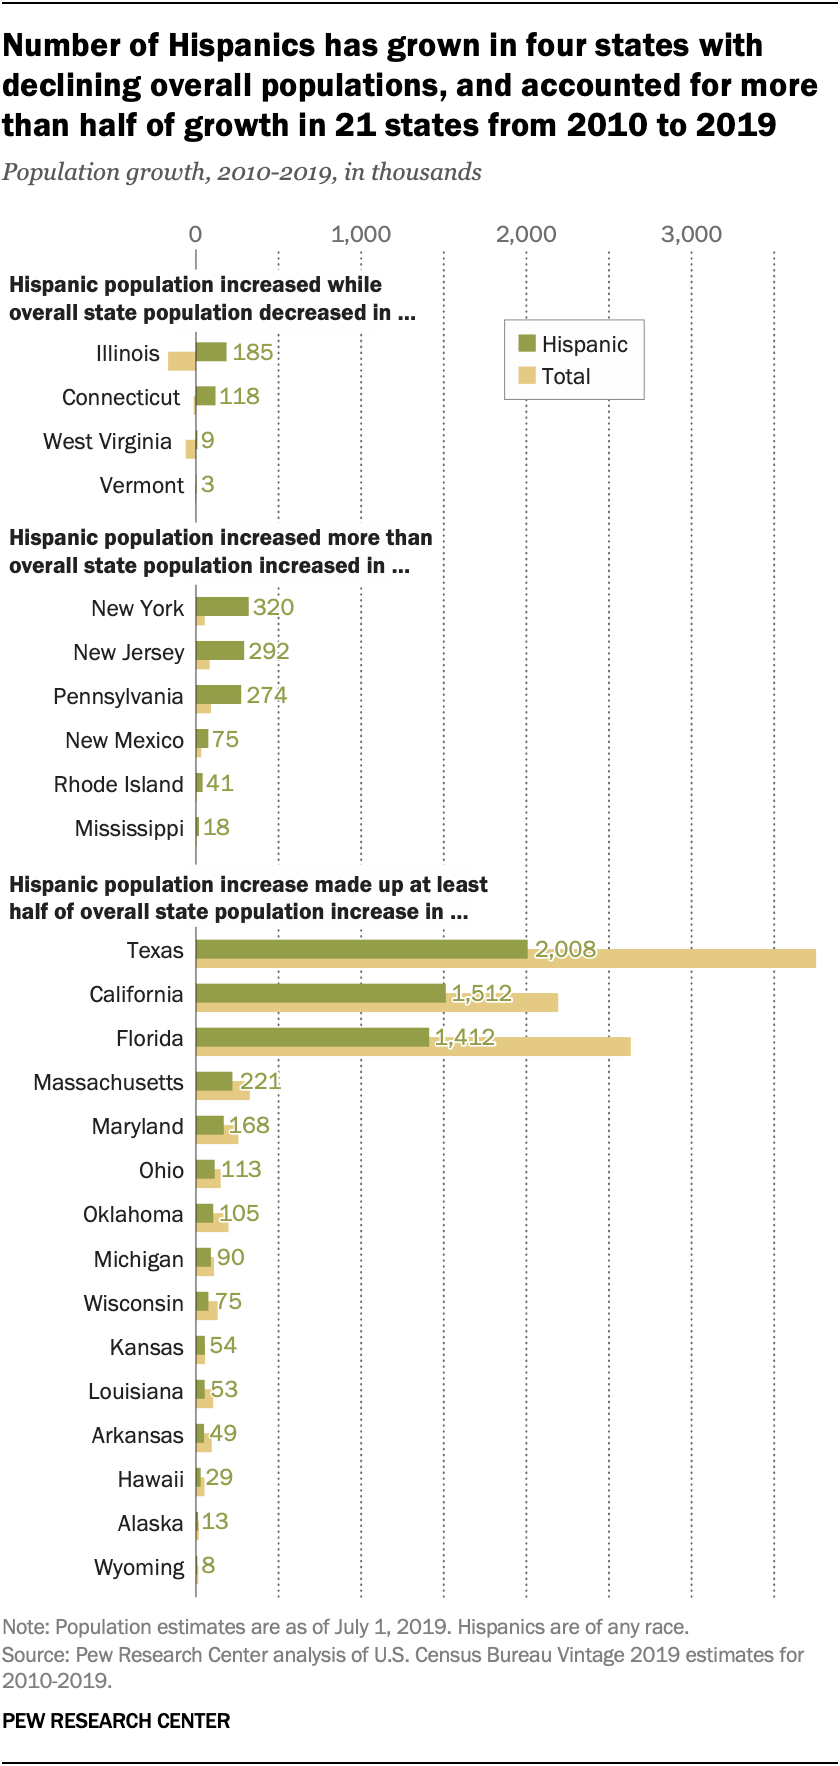 In four states – Illinois, Connecticut, West Virginia and Vermont – the Latino population increased from 2010 to 2019, even though the overall state population declined during this time. The decreases happened almost entirely among the white populations of these states (both Black and white populations declined in Illinois).
In 21 other states, Hispanics accounted for more than 50% of statewide population increases from 2010 to 2019. In six of these states – New York, New Jersey, Pennsylvania, New Mexico, Rhode Island and Mississippi – Latino population growth exceeded that of the overall population during this time, again largely due to declines among the white population.
In New York, the number of Latinos increased by 319,500 even as the state population went up by only 53,700. In Pennsylvania, the Latino population jumped by 273,900, while the state’s population increased by 90,800. States with much smaller populations saw similar patterns. In Rhode Island, the Hispanic population jumped by 40,600 as the state population increased by only 5,400. In Mississippi, the Hispanic population increased by 18,100 even as its overall population was up by only 5,600.
Half of U.S. Hispanics live in Southwest border states, but fastest population growth is elsewhere
Some of the nation’s largest Hispanic populations are in the four states that border Mexico – California, Texas, Arizona and New Mexico. In fact, the two states with the most Hispanics, California (15.6 million) and Texas (11.5 million), alone account for 45% of the nation’s Hispanic population. Together, the four border states were home to 50% of U.S. Hispanics in 2019.
Major Latino populations are also dispersed around the country. Florida has 5.7 million Latinos, the third-highest total in the country. Twelve states had Latino populations of more than 1 million in 2019, up from eight in 2010. The states that have surpassed 1 million Latinos since 2010 are Georgia, New Mexico, North Carolina and Pennsylvania.
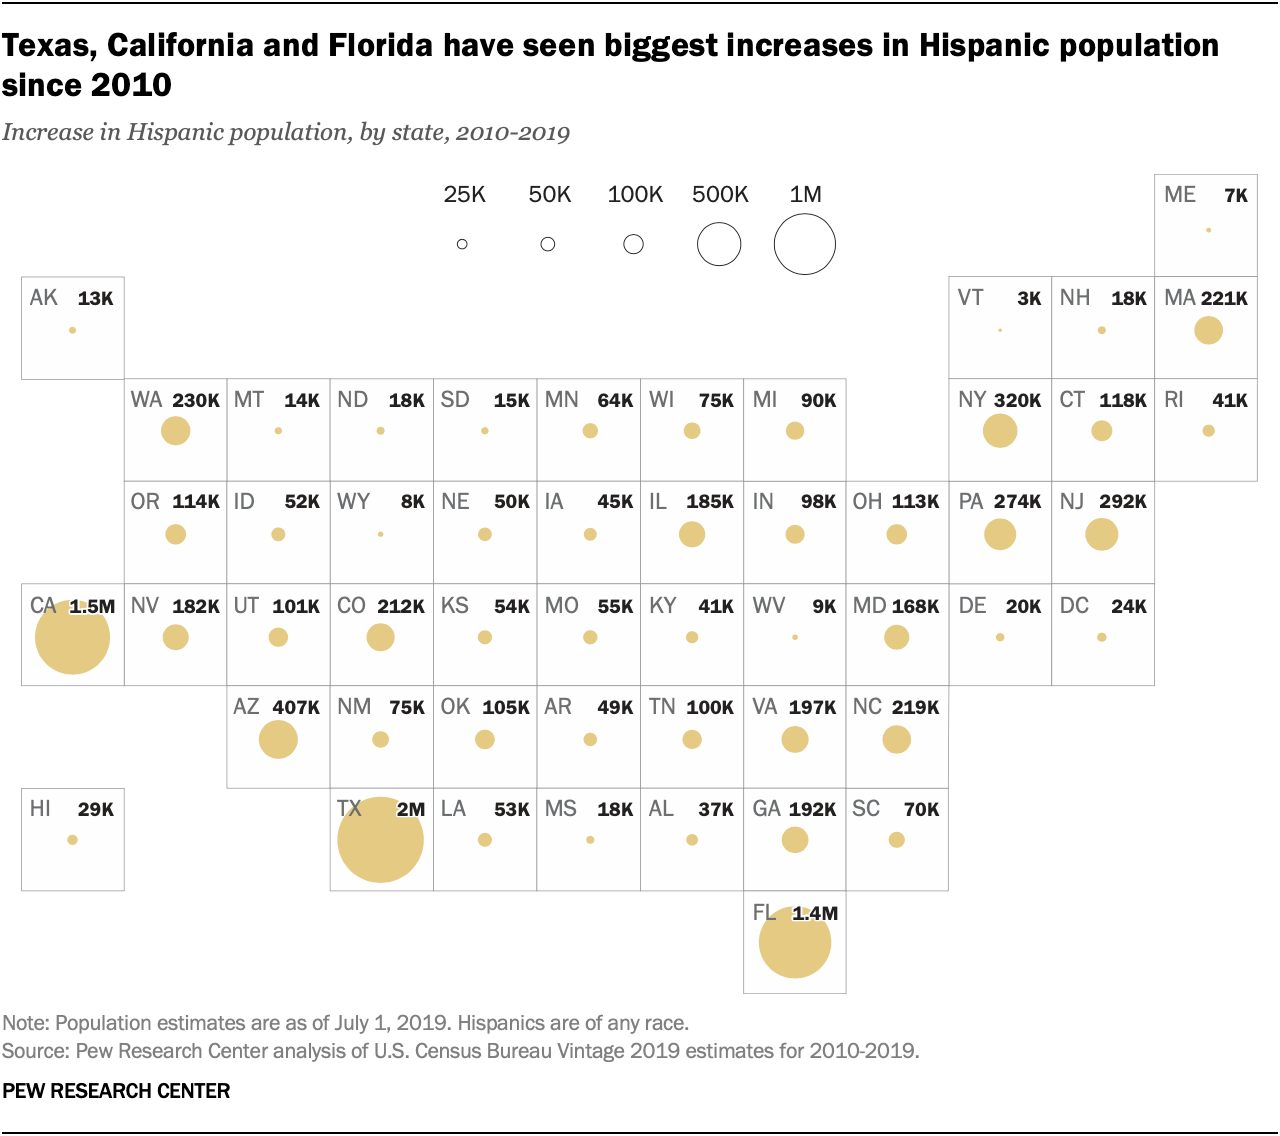
The three states with the most Hispanics also had the biggest increases of this population from 2010 to 2019: Texas (2.0 million increase), California (1.5 million) and Florida (1.4 million). These states accounted for half (50%) of U.S. Hispanic population growth during this time. The smallest increases came in West Virginia (8,800), Wyoming (8,100), Maine (6,700) and Vermont (3,400). No state saw a decrease in Hispanics.
By region, the South saw the fastest growth in Latino population, increasing by 26% from 2010 to 2019, followed by the Northeast (18%), Midwest (18%) and West (14%). The South has accounted for nearly half (48%) of Latino population growth since 2010.
Of the 12 states with at least 1 million Hispanics, Pennsylvania saw the fastest population growth, 38% from 2010 to 2019. Four of these states have had the slowest Hispanic population growth in the U.S. since 2010: California (11%), New York (9%), Illinois (9%) and New Mexico (8%).
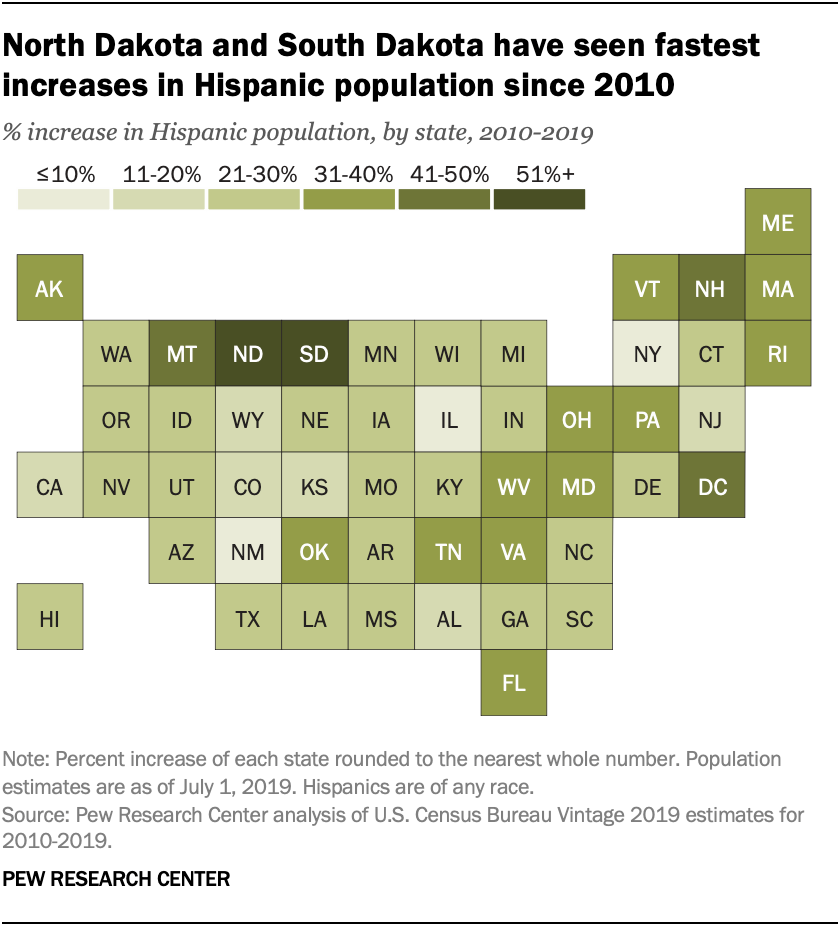 Several states with Hispanic populations of less than 100,000 had some of the fastest increases from 2010 to 2019. North Dakota saw its Hispanic population more than double (129% increase) to 31,500 in 2019, the fastest growth of any state. South Dakota (up 66% to 37,400), Montana (up 50% to 43,300) and New Hampshire (up 48% to 54,600) had the next fastest increases. The District of Columbia’s Hispanic population grew by 42%, to 79,500 in 2019.
States with large Hispanic populations have highest median ages
The median age of U.S. Hispanics is 30. The four states with the highest median ages also have some of the nation’s largest Hispanic populations: Florida (36 years), New York (33), New Mexico (33) and New Jersey (32). The two most populated Hispanic states, California and Texas, have median ages of 30 and 29, respectively.
Among the 12 states with more than 1 million Hispanics, North Carolina (25 years), Georgia (27), Pennsylvania (28) and Arizona (28) have the lowest median ages.
The two youngest states by median age, South Dakota (23) and North Dakota (24), have among the smallest Hispanic populations in the country. Each has fewer than 40,000 Hispanics.


