
America’s newsrooms are changing in important ways. Mergers, closures and layoffs have affected a variety of media organizations – especially newspapers – and these trends are changing the nation’s media landscape.
Here are 10 charts on the state of newsroom employment in the United States today, based on data from the Bureau of Labor Statistics, the Census Bureau and other sources.
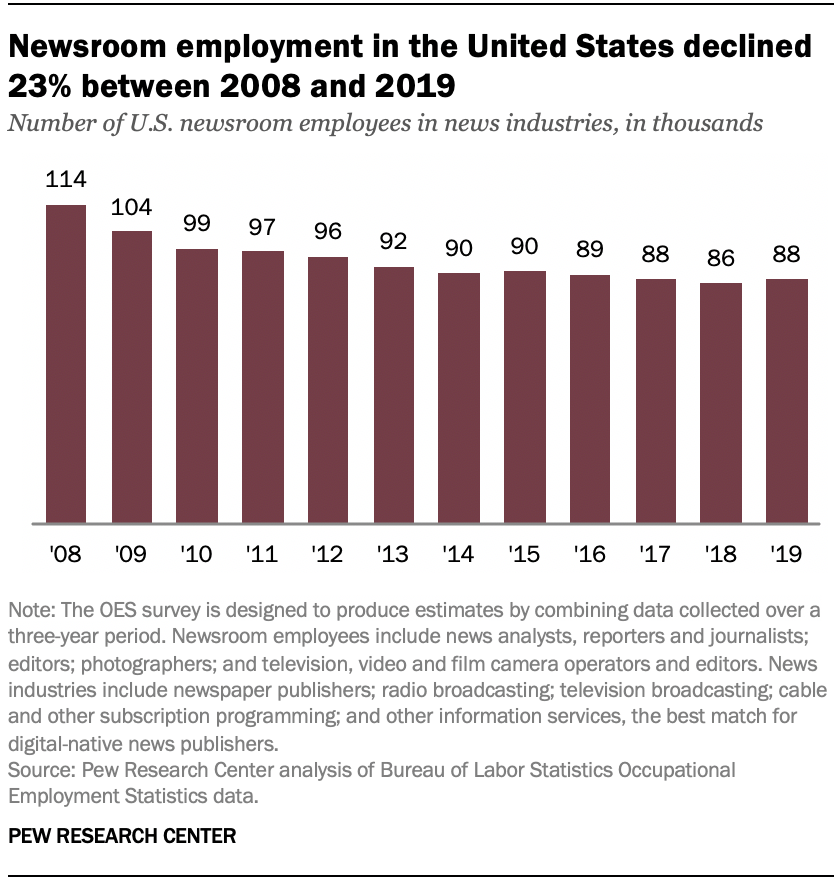 1Newsroom employment in the U.S. dropped by 23% between 2008 and 2019. In 2008, there were about 114,000 newsroom employees – reporters, editors, photographers and videographers – in five industries that produce news: newspaper, radio, broadcast television, cable and “other information services” (the best match for digital-native news publishers). By 2019, that number had declined to about 88,000, a loss of about 27,000 jobs, according to data from the Bureau of Labor Statistics.
The bulk of the decline in total newsroom employment occurred in the first half of this period. Between 2008 and 2014, the number of newsroom employees dropped to 90,000, a loss of about 24,000 jobs. After 2014, the number of newsroom employees stabilized, averaging about 88,000 workers through 2019, with little to no change over the five-year period.
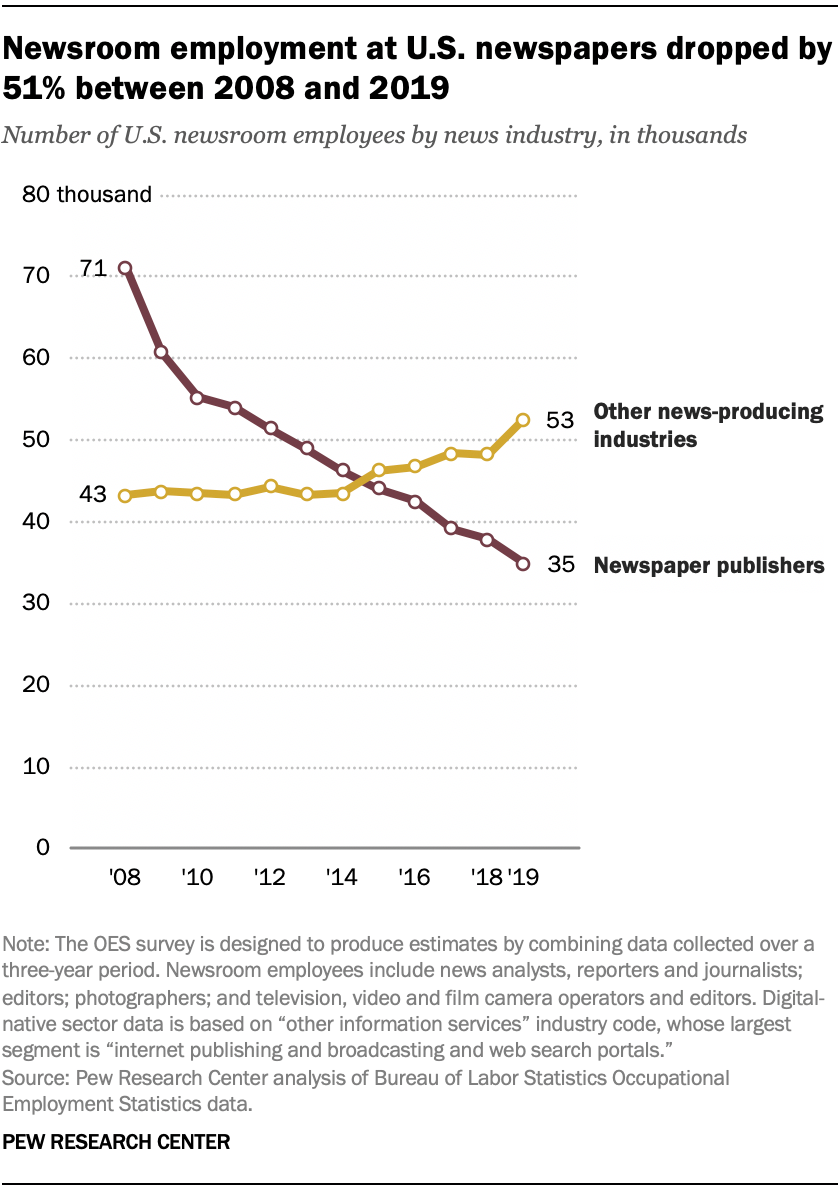 2Newsroom employment at U.S. newspapers dropped by about half between 2008 and 2019. The long-term decline in newsroom employment has been driven primarily by one sector: newspapers. The number of newspaper newsroom employees dropped by 51% between 2008 and 2019, from about 71,000 workers to 35,000.
Combined newsroom employment in the other four news-producing industries – broadcast television, radio, cable and digital-native – remained relatively stable, even rising modestly after 2014. Between 2008 and 2014, the number of newsroom employees in these other sectors averaged about 43,000, a figure that increased to about 53,000 by 2019.
The increase of more than 9,000 jobs in the non-newspaper industries nearly offset the loss of about 11,000 newspaper newsroom employees after 2014. However, it fell far short of offsetting the total loss of about 36,000 newspaper jobs over the entire 2008-2019 period.
The dramatic decline in employment at newspapers means that newspapers now account for a much smaller portion of overall newsroom employment than in the past. In 2008, newspaper newsroom employees made up about six-in-ten (62%) of all newsroom employees. By 2019, the share had dropped to four-in-ten (40%).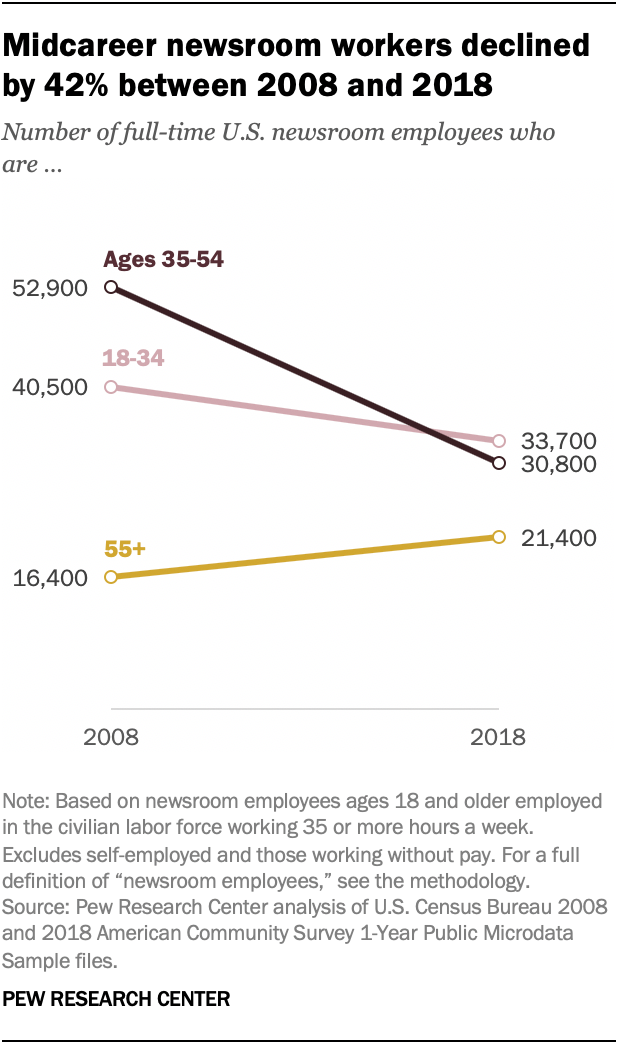
3The decade-long decline in U.S. newsroom employment hit midcareer workers the hardest. The number of full-time midcareer newsroom employees – defined as those ages 35 to 54 – dropped by 42% between 2008 and 2018, from about 52,900 to 30,800 workers, according to Census Bureau data. The number of newsroom workers ages 55 and older increased by 31% during this period, from about 16,400 to 21,400 – but not enough to offset the losses in the midcareer age group. The number of younger newsroom employees (ages 18 to 34) remained relatively stable, with no significant change occurring over the decade.
4Layoffs have pummeled U.S. newspapers in recent years. Roughly a quarter of U.S. newspapers with an average Sunday circulation of 50,000 or more (27%) experienced layoffs in 2018, according to a Pew Research Center analysis of news articles that cited staff layoffs at these outlets. The layoffs came on top of the roughly one-third (32%) of papers in the same circulation range that experienced layoffs in 2017.
Some papers experienced more than one round of layoffs within the same year, particularly in 2018. Among the daily newspapers that had layoffs in 2018, about a third (31%) went through more than one round. In 2017, by comparison, 17% of newspapers that experienced layoffs endured multiple rounds.
While news reports did not always provide the exact number of newsroom staff being laid off, some broad conclusions can be drawn from the data. Among the newspapers for which the Center could determine the number of laid-off staff, 62% laid off more than 10 people in 2018, more than the 42% that did so in 2017. This suggests a year-over-year increase in the number of jobs typically cut by newspapers during layoffs.

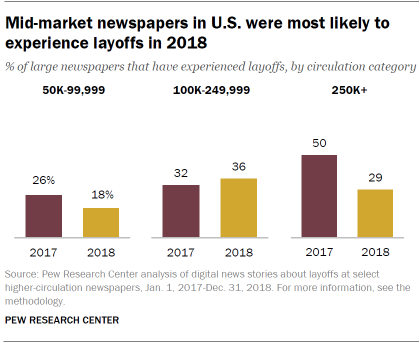 5The brunt of layoffs hit mid-market newspapers in 2018. Mid-market newspapers – those with average Sunday circulations between 100,000 and 249,999 – were more likely than either lower- or higher-circulation newspapers to have experienced layoffs in 2018.
Roughly a third of mid-market newspapers (36%) had layoffs, compared with 18% of lower-circulation newspapers (those with circulations between 50,000 and 99,999) and 29% of high-circulation newspapers (at least 250,000).
The share of layoffs at mid-market newspapers increased somewhat between 2017 and 2018, while it declined for both lower- and high-circulation papers.
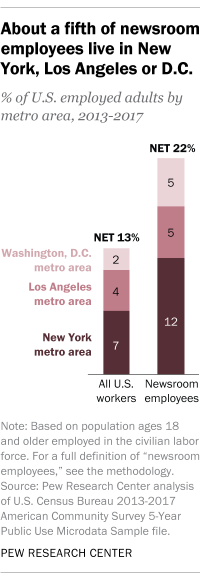 6One-in-five newsroom employees live in New York, Los Angeles or Washington, D.C. The financial, entertainment and political capitals of the U.S. are home to a disproportionately large share of the nation’s newsroom employees. About one-in-five newsroom employees (22%) live in these metro areas, which, by comparison, are home to 13% of all U.S. workers, according to a Center analysis of Census Bureau data covering the period from 2013 to 2017.
Long known as the media capital of the world, New York, at 12%, has the greatest share of all newsroom employees. This is more than twice the share living in the Los Angeles and Washington metro areas, each of which is home to 5% of the nation’s newsroom employees.
While a disproportionate share of newsroom employees live in these three cities, this does not appear to be a growing trend. Roughly the same share of newsroom employees (20%) lived in these three metro areas in the 2005-2009 period, according to Census Bureau data.
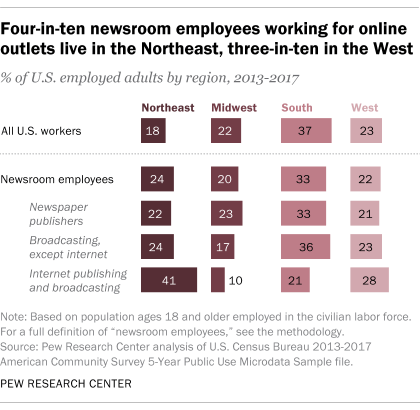
7Newsroom employees are more likely than U.S. workers overall to work in the Northeast. Roughly a quarter (24%) of all newsroom employees work in this region, compared with 18% of workers overall.
Employment at online news outlets is especially concentrated in the Northeast. About four-in-ten newsroom employees who work in internet publishing live in the Northeast (41%). Another 28% live in the West.
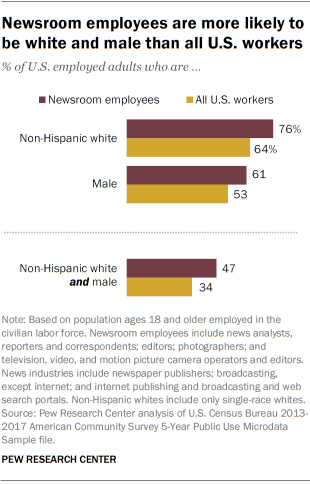 8 Newsroom employees are less demographically diverse than U.S. workers overall. For one, they are more likely to be white. About three-quarters (76%) of newsroom employees are non-Hispanic white. That is true of 64% of U.S. workers in all occupations and industries combined.
Newsroom employees are also more likely than workers overall to be male. About six-in-ten newsroom employees (61%) are men, compared with 53% of all workers. When combining race, ethnicity and sex, almost half (47%) of newsroom employees are non-Hispanic white men, compared with about a third (34%) of workers overall.
Younger newsroom employees show greater racial, ethnic and gender diversity than their older colleagues. Around four-in-ten newsroom employees ages 18 to 29 are non-Hispanic white men (38%), compared with 46% of those ages 30 to 49 and 56% of those 50 and older. In each of these age groups, however, newsroom workers are still less diverse than workers overall.
9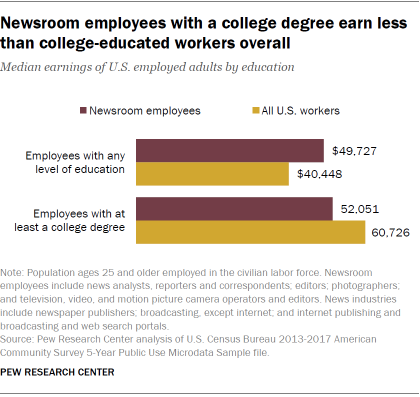 Newsroom employees with a college degree earn less than other college-educated workers. Newsroom employees are more than twice as likely as other U.S. workers to be college graduates. Nearly eight-in-ten newsroom employees (79%) have a college degree, while about four-in-ten U.S. workers overall (37%) graduated from college.
But college-educated newsroom employees tend to make less money than college-educated workers on the whole. The median earnings of newsroom employees with a college degree are about $52,000 a year, compared with roughly $61,000 for all college-educated workers.
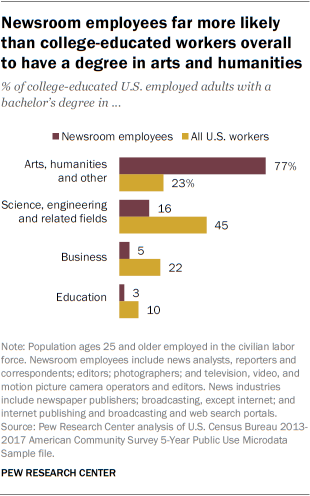 10Newsroom employees are far more likely than college-educated workers overall to have a degree in the arts and humanities. About three-quarters (77%) of college-educated newsroom employees have undergraduate degrees in the arts and humanities, more than three times the share among all college-educated workers in the U.S. (23%). College-educated workers overall, by comparison, are much more likely than those working in newsrooms to have bachelor’s degrees in science, engineering and related fields (45% vs. 16%) and business (22% vs. 5%), as well as education (10% vs. 3%).
Three-in-ten college-educated newsroom employees have a degree in journalism, making it the most common college major of these workers. Other common majors include communications (13%), English language and literature (11%) and mass media (7%). About 23% of newsroom employees with a college degree majored in something outside of arts and humanities.
Note: This is an update of a post originally published Nov. 26, 2019.


