Tax-deadline season isn’t many people’s favorite time of the year, but most Americans are OK with the amount of tax they pay. It’s what other people pay, or don’t pay, that bothers them.
Just over half (54%) of Americans surveyed in fall by Pew Research Center said they pay about the right amount in taxes considering what they get from the federal government, versus 40% who said they pay more than their fair share. But in a separate 2015 survey by the Center, some six-in-ten Americans said they were bothered a lot by the feeling that “some wealthy people” and “some corporations” don’t pay their fair share.
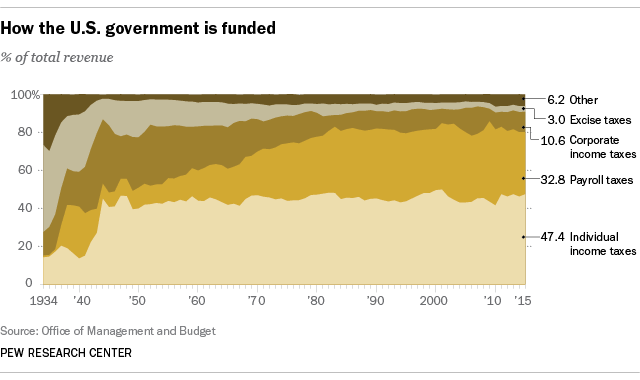
It’s true that corporations are funding a smaller share of overall government operations than they used to. In fiscal 2015, the federal government collected $343.8 billion from corporate income taxes, or 10.6% of its total revenue. Back in the 1950s, corporate income tax generated between a quarter and a third of federal revenues (though payroll taxes have grown considerably over that period).
Nor have corporate tax receipts kept pace with the overall growth of the U.S. economy. Inflation-adjusted gross domestic product has risen 153% since 1980, while inflation-adjusted corporate tax receipts were 115% higher in fiscal 2015 than in fiscal 1980, according to the Bureau of Economic Analysis. There have been a lot of ups and downs over that period, as corporate tax receipts tend to rise during expansions and drop off in recessions. In fiscal 2007, for instance, corporate taxes hit $370.2 billion (in current dollars), only to plunge to $138.2 billion in 2009 as businesses felt the impact of the Great Recession.
Corporations also employ battalions of tax lawyers to find ways to reduce their tax bills, from running income through subsidiaries in low-tax foreign countries to moving overseas entirely, in what’s known as a corporate inversion (a practice the Treasury Department has moved to discourage).
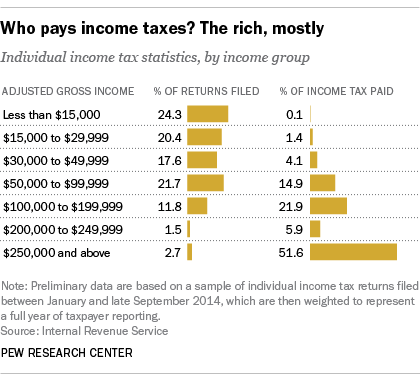
But in Tax Land, the line between corporations and people can be fuzzy. While most major corporations (“C corporations” in tax lingo) pay according to the corporate tax laws, many other kinds of businesses – sole proprietorships, partnerships and closely held “S corporations” – fall under the individual income tax code, because their profits and losses are passed through to individuals. And by design, wealthier Americans pay most of the nation’s total individual income taxes.
 In 2014, people with adjusted gross income, or AGI, above $250,000 paid just over half (51.6%) of all individual income taxes, though they accounted for only 2.7% of all returns filed, according to our analysis of preliminary IRS data. Their average tax rate (total taxes paid divided by cumulative AGI) was 25.7%. By contrast, people with incomes of less than $50,000 accounted for 62.3% of all individual returns filed, but they paid just 5.7% of total taxes. Their average tax rate was 4.3%.
The relative tax burdens borne by different income groups changes over time, due both to economic conditions and the constantly shifting provisions of tax law. For example, using more comprehensive IRS data covering tax years 2000 through 2011, we found that people who made between $100,000 and $200,000 paid 23.8% of the total tax liability in 2011, up from 18.8% in 2000. Filers in the $50,000-to-$75,000 group, on the other hand, paid 12% of the total liability in 2000 but only 9.1% in 2011. (The tax liability figures include a few taxes, such as self-employment tax and the “nanny tax,” that people typically pay along with their income taxes.)
All told, individual income taxes accounted for a little less than half (47.4%) of government revenue, a share that’s been roughly constant since World War II. The federal government collected $1.54 trillion from individual income taxes in fiscal 2015, making it the national government’s single-biggest revenue source. (Other sources of federal revenue include corporate income taxes, the payroll taxes that fund Social Security and Medicare, excise taxes such as those on gasoline and cigarettes, estate taxes, customs duties and payments from the Federal Reserve.) Until the 1940s, when the income tax was expanded to help fund the war effort, generally only the very wealthy paid it.
Since the 1970s, the segment of federal revenues that has grown the most is the payroll tax – those line items on your pay stub that go to pay for Social Security and Medicare. For most people, in fact, payroll taxes take a bigger bite out of their paycheck than federal income tax. Why? The 6.2% Social Security withholding tax only applies to wages up to $118,500. For example, a worker earning $40,000 will pay $2,480 (6.2%) in Social Security tax, but an executive earning $400,000 will pay $7,347 (6.2% of $118,500), for an effective rate of just 1.8%. By contrast, the 1.45% Medicare tax has no upper limit, and in fact high earners pay an extra 0.9%.
All but the top-earning 20% of American families pay more in payroll taxes than in federal income taxes, according to a Treasury Department analysis.
Still, that analysis confirms that, after all federal taxes are factored in, the U.S. tax system as a whole is progressive. The top 0.1% of families pay the equivalent of 39.2% and the bottom 20% have negative tax rates (that is, they get more money back from the government in the form of refundable tax credits than they pay in taxes).
Of course, people can and will differ on whether any of this constitutes a “fair” tax system. Depending on their politics and personal situations, some would argue for a more steeply progressive structure, others for a flatter one. Finding the right balance can be challenging to the point of impossibility: As Jean-Baptiste Colbert, Louis XIV’s finance minister, is said to have remarked: “The art of taxation consists in so plucking the goose as to obtain the largest possible amount of feathers with the smallest possible amount of hissing.”
Note: This is an update of an earlier post published March 24, 2015.


