&feature=youtu.be
The classic nuclear family, the kind imprinted on the American imagination by TV shows like Leave It To Beaver, has been left behind. In 1960, 37% of households included a married couple raising their own children. More than a half-century later, just 16% of households look like that.
Here are 5 facts about the modern family:
1 Americans are putting off life’s big milestones. Today, the median age at first marriage is 29 for men and 27 for women—the highest in modern history. (In 2013, more than one-in-four (26%) of people ages 18 to 32 were married. But in 1960, well over half (65%) of Americans were.) Mothers are also waiting longer to have children. In 1960, women ages 15 to 24 accounted for 40% of mothers with infants. By 2011, that number had dropped to 22%.
2 Today, an American woman, on average, is expected to have 1.9 children, compared with a total fertility rate of 3.7 children in 1960. Current levels are below the “replacement rate” of about 2.1 children, the number of births needed for children to replace their parents in the population. Some European countries have lower total fertility rates.
3 Some 3 million (37% of) lesbian, gay, bisexual and transgender adults have had a child at some point in their lives, according to the Williams Institute. Among women under the age of 50 who identify as LGBT (and live alone or with a spouse/partner), about half (48%) have a child younger than 18. Some one-in-five LGBT men say the same.
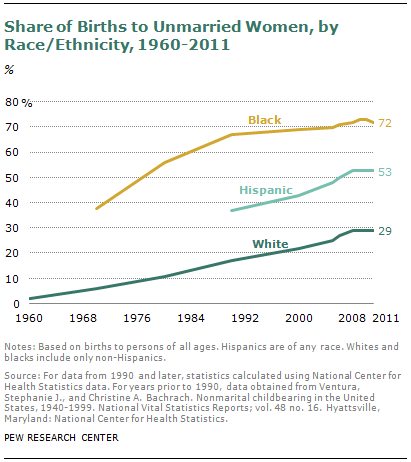
4  Families today are more blended and differently constructed. Nearly half (44%) of young people ages 18 to 29 have a step sibling. About half as many (23%) of those ages 50 to 64—and just 16% of those 65 or older—have a step sibling. More babies are born to unmarried mothers than ever before. Unmarried women accounted for 41% of births in 2011, up from just 5% in 1960. In 2011, 72% of births to black women were to unmarried mothers, compared with 53% of births to Hispanic women and 29% of births to white women. (The sample size was too small to analyze results among Asians.) But just 9% of new mothers with a bachelor’s degree, regardless of race, were unmarried when they gave birth.
5 Intermarriage among people of different races is increasingly common. In 1980, just 7% of all marriages in the U.S. were between spouses of a different race or ethnicity. In 2010, that share has doubled to 15% of all new marriages in the U.S. Hispanics (26%) and Asians (28%) were most likely to “marry out,” compared with 9% of whites and 17% of blacks.


