by D’Vera Cohn, Senior Writer, Pew Research Center
The breakup of the 40-year marriage of former Vice President Al Gore and his wife Tipper raises the intriguing question: What is the likelihood that a long-duration marriage will end in divorce?
On an annual basis, the probability is very small, according to Census Bureau statistics from the American Community Survey. In 2008, among couples married for four decades or more, half a percent or less had obtained a divorce in the previous 12 months. (Among couples married for 25 years or more, the share that divorced in the previous year rises to about 1 %.)

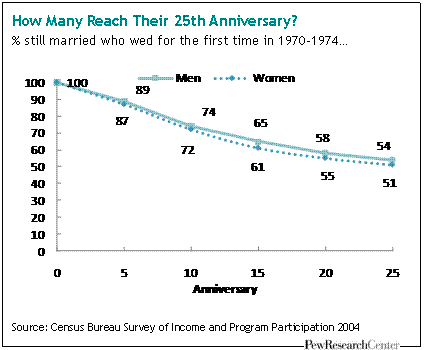
To be sure, aging — and, eventually, spousal death — do take their toll on marriage. Obviously, the longer couples remain married, the longer they are at risk of having their marriage end. In any given year, short-duration marriages are most likely to be intact. As one illustration, among men who got married for the first time between 1970 (the year the Gores wed) and 1974, 89% were still married to the same wife on their fifth anniversary, 74% on their 10th anniversary and 65% on their 15th anniversary. By their 20th anniversary, 58% were married; by their 25th, 54% were.
These statistics are from the 2004 Survey of Income and Program Participation (SIPP) so the numbers do not reveal what share of these marriages survives until their 40th anniversary. Trends for women who married during the early 1970s are similar to those for men, but the shares still married to their initial spouse on each anniversary are lower; women are more likely to be widowed than men.
Another way to look at the likelihood of divorce is to project the lifetime risk of divorce from first marriage for different age groups, based on the assumption that current rates will not change in the future. In 1996, when divorce rates were somewhat higher than they are today, Census Bureau researchers constructed such a set of projections, using data from the SIPP.
The risk was highest (more than 50%) for adults who were 25 years old in 1996. For 50-year-old men, 45% were projected to divorce eventually; for 50-year-old women, 46% were. (The Gores were 48 years old at the time.) The Census Bureau report also projected that 81% of the 50-year-old men who divorced their first wives eventually would remarry, and that 71% of 50-year-old women who divorced their first husbands would do so.
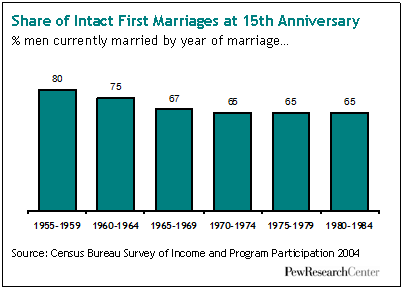
What these overall statistics don’t say is that the risk of divorce is not the same for all groups. Adults with a high school education or less are more likely to divorce than are college-educated adults. People who marry young are more likely to divorce than those who marry at older ages. There also is some early evidence that couples who married in the 1970s may be especially at risk of divorce. According to data from the 2004 SIPP, the share of marriages that ended before their 15th anniversaries (mainly because of divorce, but also in a small number of cases because of widowhood) was lowest for marriages made in the 1950s, followed by those made in the 1960s and then those made in the 1980s. Marriages made in the 1970s were slightly less likely to reach their 15th anniversary than those begun in the 1980s.
 How large a share of the people who divorce each year is from the Gores’ generation? Most divorces occur among younger people and younger marriages. Among first marriages that split up, men divorce at a median age of 31.8 and women at a median age of 29.4, according to SIPP statistics. In 2003, only 11% of men who separated and 10% of those who obtained a divorce were ages 55-64. Among women, only 4% of those who separated and 8% of those who divorced were ages 55-64.
Although adults in the Gores’ age group are only a small share of people who get divorced in any given year, their cumulative likelihood of ever having been divorced is higher than that of most other adults. Among men in their 50s in 2004, 38% had ever been divorced, according to SIPP statistics, as were 34% of men in their 60s. Among women in their 50s, 41% had ever been divorced; among those in their 60s, 32% had been.
The larger pattern in divorce statistics is this: The national divorce rate is higher now than it was a century ago, but it has been declining for the past two decades. According to provisional data for most states from the Centers for Disease Control, there were 3.5 divorces per 1,000 people in 2008, compared with 4 per 1,000 people in 2000. (Marriage rates have also declined but the divorce rate also has declined if expressed as the number of divorces per 1,000 married couples.)
1. The Survey of Income and Program Participation is a longitudinal survey conducted by the U.S. Census Bureau that collects data from panels of U.S. adults on economic and demographic topics.
2. Stevenson, Betsey and Justin Wolfers. “Marriage and Divorce: Changes and their Driving Forces.” Journal of Economic Perspectives, Vol. 21, No. 2, Spring 2007. Also see by the same authors, “Trends in Marital Stability,” a paper on the authors’ home pages.


