by Scott Keeter, Director of Survey Research, The Pew Research Center
This commentary is adapted from a keynote address to the 31st Annual Research Symposium College of Communication and Information, University of Tennessee, Feb. 27, 2009.
Perhaps I should have entitled this “Old Tricks and New Tricks,” since all of us, whatever our generation, have been given a legacy of tried-and-true methods for research — and we may all be finding these a bit out-of-date.
Communication research is in a period of transformation. Both the phenomena we study and the tools we have to study it with are undergoing rapid change. Those of us in the trenches see the day to day change as making our jobs more difficult, but we should also not lose sight of the fact that there is an exciting aspect to this change — the object of our study is both more interesting and perhaps in some respects more amenable to study than ever before. I want to focus on four things today:
- What is happening to our main methodology for studying human behavior, the survey.
- The changing communications world that we are trying to study.
- Some new sources of data about the communications world.
- The downsides and upsides.
Survey research
The principal tool for communication research for most of my lifetime has been the random sample survey. Most of the classic studies in political communications and other subfields were based on surveys with probability samples of the public. But now such surveys are imperiled by a combination of problems.
The first is declining respondent cooperation. Response rates for all surveys are falling, whether we are talking about the U.S. Census, the Current Population Survey, the General Social Survey, election polls, recruitment surveys for Nielsen and Arbitron. People are busier; more are concerned about breaches of privacy and identity theft; they have more tools available to help them avoid surveys; and there are more surveys and calls that sound like surveys.
Take for example the University of Michigan’s Survey of Consumer Attitudes, which produces the monthly Consumer Confidence Index. Response rates dropped from 72% in 1979 to 60% in 1996, to 48% in 2003. The rate of decline after 1996 was nearly twice as steep as between 1979 and 1996. And surveys by major media polling organizations, including the Pew Research Center, now have response rates in the 15-25% range, and many are even lower.
The second big problem for phone surveys is the growing number of households not reached by a landline telephone.
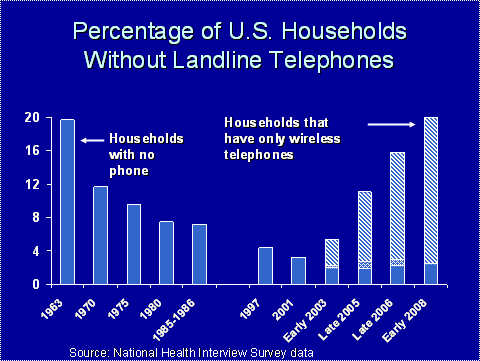
This graph shows the trend since 1963 in the percentage of households with no landline. Amazingly, the landline non-coverage rate is as high today as it was in 1963. Of course, the reasons are very different. Back then, the problem was households with no phone service. Today, it’s the wireless-only household.
We estimate that the percentage of households that are wireless only is now about 20%, and it’s been growing at the rate of about 2 percentage points every six months.
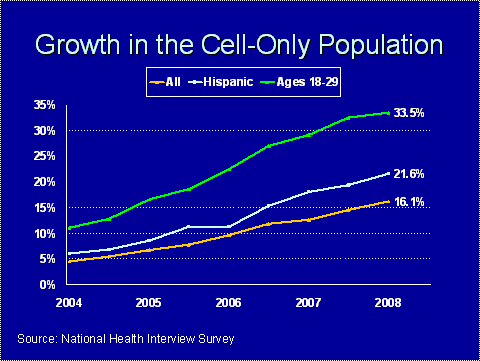
The rate is higher among some important subgroups for communications researchers — young people, non-whites, urban residents.
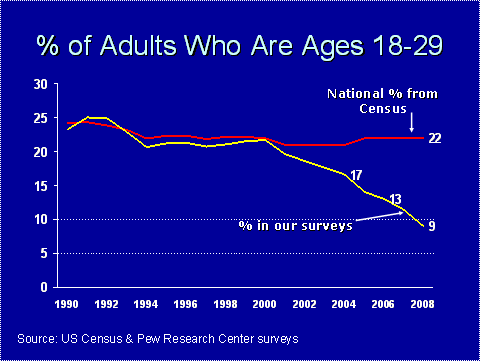
This has big consequences for surveys and for communications researchers. Here’s one of the most important: young respondents are vanishing from our landline samples.
Fortunately we can deal with this. We can call cell phones. Telephone numbers assigned to cell phones are in blocks separate from landlines, and we can develop samples from them. We have found that people on cell phones are about as willing to be interviewed as those on landlines. So we can include them, and at the Pew Research Center and many other national polling organizations, we’ve decided that we have to do so as a matter of course.
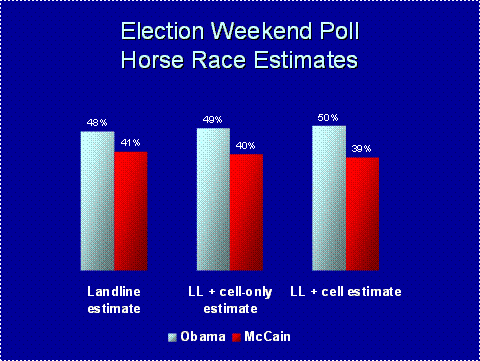
Being able to include cell phones allows us to estimate whether landline surveys have a significant bias if they don’t have cell phones, since we can compare our landline samples and the samples that combine landline and cell phones. Most of our survey estimates are not significantly biased if we rely only on the landlines. In the president election last fall, we would have forecast a slightly narrower victory by Obama had we relied only on cell phones — but we would still have gotten the right winner. The most troubling aspect, however, is that the size of this bias is creeping upward as the cell-only population grows.
But even though we can call cell phones and include them in our samples, cell phone interviewing is extremely expensive. When you add in the fact that landline surveys are more expensive now, because of the extra effort needed to reach reluctant respondents and persuade them to talk, we have seen our costs escalate dramatically. We find that a cell phone interview costs 2- 2.5 times as much as a landline interview. If we are interested in just the wireless-only respondents, the cost is as much as four times as high.
For this reason, serious attention is now paid to alternative ways of obtaining probability samples of the general public. Interestingly, one of the most promising of these is experimentation with mail surveys and mail recruitment. This seemingly modest and low-tech mode is getting lots of attention in the research world today, not only as a data-collection tool but as a means of recruiting respondents for telephone or internet-based surveys. Work done by the Centers for Disease Control, Arbitron and other organizations find that national and statewide mail samples drawn from the postal service’s Delivery Sequence File can yield response rates comparable to or even higher than those from telephone surveys. These samples also can be used to identify potential cell-only households by matching addresses against phone numbers and then surveying those for which a number cannot be found.
Will the internet save survey research?
The internet is an increasingly popular place for surveys. It can be an inexpensive means of collecting data, since no interviewer is needed. And it opens up the possibility of providing respondents with visual material, including videos, to look at and respond to. At the Pew Research Center we have collected data for several surveys on the internet, including surveys of journalists, foreign policy experts, and even the core supporters of Howard Dean’s campaign for the Democratic presidential nomination in 2004, also known as the “Deaniacs.” All of these involved random samples from known populations, with the data collection being conducted either wholly or partially online.
There are relatively few sources for conducting a survey of a probability sample on the internet. Perhaps the best known is a panel maintained by Knowledge Networks, which recruited a random sample of households by telephone and gave internet service to those who did not have it. We have used them for surveys, as have other organizations. In fact, just this week a Knowledge Networks panel provided an immediate public reaction poll for CBS News after President Obama’s address to Congress on Tuesday. But even Knowledge Networks samples face the same problems of relatively low total response rates and imperfect population coverage that plague other surveys, as well as problems unique to panels, such as attrition and panel conditioning.
Online panels that use probability-based methods of recruitment remain quite expensive. Because of the cost, people are building online panels with convenience samples, rather than true random samples of the U.S. public. It’s probably safe to say that most market research is conducted using such online panels and samples these days. But there is a lot of concern about data quality. In 2006, a research executive for Procter and Gamble told an industry forum that the quality of the market research data they were getting from online panels had been deteriorating, and that it was increasingly hard to trust the data. That discussion led to a major effort to establish higher standards for online panels, but for organizations such as Pew Research, the inability to generalize from online non-probability samples to the general public with a known degree of accuracy has prevented us from using them.
There is intriguing work underway to achieve greater predictability from online panels. One such effort, by one of the founders of Knowledge Networks, uses a sophisticated matching algorithm based on samples from the American Community Survey to produce panels that yield results very similar to those from telephone surveys. But there remains significant opposition to the use of such panels among many organizations.
The changing communication environment
Our challenges don’t end with the problem of our data collection methods. Equally challenging — and perhaps exciting — is what is happening to the phenomena we are studying. For mass communications researchers, the debate over what constitutes mass communications has been going on ever since the term first appeared many decades ago. And the observation that there is no longer a mass audience, but rather a lot of niche and specialized audiences, is hardly new. Russell Neuman in 1991 wrote a book entitled “The Future of the Mass Audience”, which asked good questions about the potential fragmentation of audiences. His verdict at the time was that extreme fragmentation was unlikely to occur. By some standards his view has been upheld: network news still attracts audiences much larger than any cable TV news show, for example. But much more is going on.
Markus Prior’s very provocative book “Post-Broadcast Democracy” notes that the “roadblock” for TV audiences who wanted to avoid network news was lifted with the advent of cable television, allowing people to “go where they wanna go.” The internet is a hyper version of this phenomenon. The consequences for democracy, he writes, are that the politically engaged and information rich can get much, much richer, while the unengaged and information poor can avoid learning much of anything about the political world.
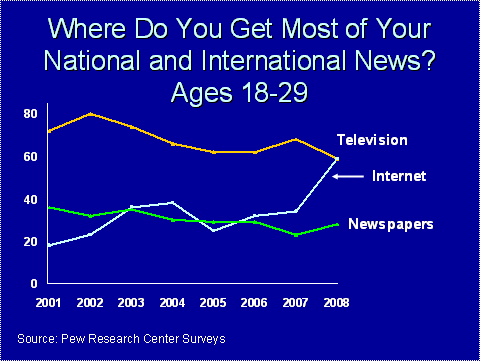
Even trying to track the audiences for major-media sources is getting increasingly difficult as content generated by a particular source gets distributed through multiple media. Consider Pew’s long-term trend in what we call the “main source” for national and international news.
Television still dominates. Newspapers are falling on hard times. Just this past December, we documented that the internet had surpassed newspapers as the second most common source for the public. For young people, newspapers and the internet have been dueling for most of this decade, and in 2008 the internet finally swamped newspapers — and matched television as a news source.

But, not so fast. Let’s take newspapers. They are really getting pounded right now. Print readership is down, down, down. But we have good evidence that eyeballs are not down nearly as much, even among young people. In 2008 our big media consumption survey found that 30% of the public read a newspaper in print yesterday, and 14% read one online; because some people read both, the total is 39%. That’s down 4 points from two years ago, not the right direction if you are a newspaper person. But still much better than the 8-point drop in print readership. Among young people, the number reading in print and online is virtually identical — 16% in print, 14% online, for a total of 27%.
Indeed, as our survey showed, and newspaper executives such as Bill Keller of the New York Times have observed, readership of newspapers is coming in many ways. The core of people getting it plopped on their lawn in the morning may be declining, but the number coming to the newspaper website is growing. And many are coming not to the “front door” of the website but via the “side door” — from a link on a blog or in an e-mail. Half of our survey respondents who say they get news online say they more often find themselves on a newspaper website via a link than by the direct route. That number is nearly two-thirds for online news consumers under age 25.
When we asked online news consumers where they go for news, we found that the consolidator sites such as Yahoo and Google are popular, as are primary news sources such as MSNBC and CNN. But specific newspaper sites are named by 13%. Among respondents with post-graduate educations, 28% mention newspaper sites, including 12% who specifically cite the New York Times.
Let’s turn to TV for a minute. As I noted earlier it’s still a huge source. For young people last year during the campaign, the internet matched it. But what does that mean?
One of the big trends we documented over the past year is the explosive growth in online video. The Pew Internet & American Life Project reports that the percentage of households with broadband connections has grown to 56%, and of course many more people have broadband connections at work where they can furtively watch Katie Couric interview Sarah Palin if they want to.
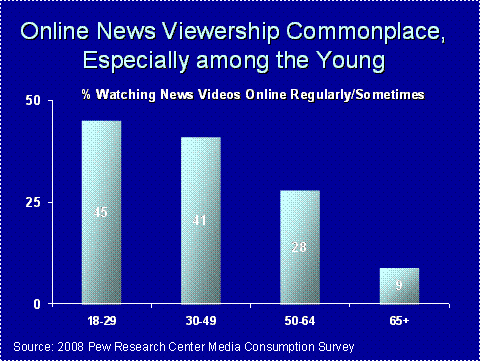
We don’t yet have a way to quantify how much of TV news viewing has shifted from the broadcast programs to the web — perhaps the networks themselves can do this — but it’s far from trivial. Take a look at these numbers from our media consumption survey: 45% of young people report watching TV news video clips online at least sometimes. And 41% of those ages 30-49 say they do, too.
When it comes to campaign videos — not just on news programs but from other sources as well — viewership is even higher. Nearly two-thirds of young voters watched, accordingly to our mid-October 2008 survey. The numbers in other age groups were not unimpressive.

Gauging what is happening in this changing world through a survey is rapidly getting much harder. People who “graze” the news — checking in from time to time rather than watching at specific times — may be consuming a lot of news, but they have a hard time remembering what they have consumed and reporting it in sufficient detail. Moreover, grazers are now the majority of the public, according to our biennial media consumption surveys.
New ways of measuring communications
With all of these challenges, we need some new sources of data. And some are out there.
One of the most intriguing is the portable people meter. It’s being used by Arbitron, the principal research group that measures radio audiences. They have persuaded many radio stations to embed an inaudible signal into their broadcasts. This can be picked up and deciphered by a device that people carry around with them. The idea is that rather than asking people to record what they are listening to, or to recall that, the PPM can detect it in real time, for how long it lasts, and send it back to Arbitron at night from its recharging cradle. Nielsen is beginning to use a similar technology for its television ratings.
But the portable people meter is not a panacea. For good estimates, Arbitron needs to recruit a valid sample of people willing to carry the device around. That recruitment raises all of the questions about surveys we discussed earlier.
When Arbitron released its first estimates based on the PPM, there was an immediate backlash from some groups. Ratings for radio stations that appeal primarily to black and Hispanic audiences suffered in the ratings, which could negatively affect their advertising revenues. Attorneys General in New York, New Jersey and Maryland filed suits to compel Arbitron to address the issue, and the company recently settled, promising to recruit a more diverse and representative sample of households for inclusion in its panel, including a larger number of cell phone-only households.
Interestingly, Arbitron is among many others using mail surveys as a means to recruit a sample of cell-phone-only households. But one of the big problems they face, and we all face, with that method, is that households with low levels of education, and especially those where English is not the first language, tend to be less responsive to mail surveys.
Beyond the people meters, there are interesting and somewhat more passive methods that track what you watch on TV or do on your home computer. Digital video recorders with services such as Tivo have the capability to track what you watch, which sections of a recorded show or commercials you skip and which you watch multiple times, and transmit all of this back to providers. Some companies, such as Comscore, draw samples of internet users and obtain their permission to place software on their home computer that tracks surfing behavior, making it possible to know which sites are visited, which news stories are read — or at least visited — and how long visits on particular sites lasted. The same type of data can be collected passively — meaning without the explicit individual consent of respondents — by internet service providers regarding the behavior of customers: where they go, what they look at, how long they stay, etc. These data, gathered on a very large scale by companies such as Hitwise, can provide statistics on the comparative popularity of different websites, even ones with small audiences that would hard to measure with a survey.
All of this provides an amazingly detailed view of what we do with our computers — much more detailed and possibly more accurate than can be painted with diaries, surveys or other methods that involve recall by respondents. And as more of our media consumption converges on computers and portable digital devices, the ability to track and measure what we read and watch will grow.
Couple this with the view from the vast databases maintained by marketers, credit agencies, political organizations, and others — household level data on virtually everyone in the U.S., which can theoretically be merged with publicly-available data from tax records, DMVs, and other sources. These records constitute a rich trove of information about most Americans.
Whether you want it out there or not, there is a lot of information about you in databases that you don’t know about or have much control over. As data-mining techniques grow more sophisticated, the power of those who have access to and control this information will also grow. Unfortunately, academics and non-profit researchers don’t have access to much of this. But we do have a responsibility to keep our voices in the conversation about how data are collected, how quality is maintained and how it’s used.
Despite these concerns and the obstacles we face, I think this is a tremendously exciting time in communications research. Both the changes in the communications world and the changes in technology that are driving it have big implications for researchers, but it’s a challenge that makes our work stimulating. For young researchers, in particular, who have grown up with the technologies and are comfortable with them and more familiar with their potential, a particularly exciting and fruitful future for our research lies ahead.


