by Scott Keeter, Pew Research Center for the People & the Press, and Gregory A. Smith, Pew Forum on Religion & Public Life
In the political caricature of recent years, America is a nation divided: red vs. blue, conservative vs. liberal. “Liberals” tend to favor an active role for government in regulating the economy, but oppose government attempts to regulate morality or private life in the social sphere. “Conservatives” take just the opposite approach, preferring a smaller role for government in the economy but a bigger role for it in promoting morality. Not surprisingly, liberals and conservatives are political opponents on most issues.
But while there is little question that U.S. politics have become more polarized in recent years, the red-blue political shorthand is far from adequate to describe the full spectrum of Americans’ political views. Judging by their opinions on a number of issues, many Americans simply do not fit well within either the conservative or the liberal ideological camps, instead falling into one of the two other important U.S. political traditions – libertarian and populist – or defying attempts to pigeon-hole them.
Americans espousing a “libertarian” ideology oppose government regulation in both the economic and the social spheres. “Populists,” by contrast, favor an active role for government in both the economic and the social spheres. Still more Americans are distinctively non-ideological in their political outlook, and so don’t fit neatly into any of the four ideological camps.
That this is so should not be surprising. Since the founding days of the Republic, Americans have battled over the appropriate balance between government power and individual liberty and both political parties and individuals have pragmatically redefined their positions on that balance as particular issues have come to the forefront of political debate. But given the current prominence – and potential incompleteness – of the liberal-conservative description, we decided to take a closer look at the current state of ideology, ideologues, and American politics.
Finding the Ideologues
How much of the public can be said to take ideologically consistent positions – that is, how many have values and views on issues that fall into one of the four important political traditions in U.S. politics?

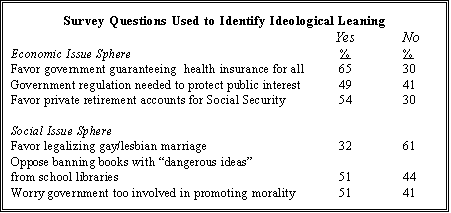
Using data from a December 2004 Pew Research Center survey of 2,000 people, we looked at a range of questions that tap opinions in both the economic and the social issue spheres, and chose three questions from each category. In the economic sphere, we picked questions about government regulation, government’s role in providing health insurance, and the creation of private accounts in Social Security. In the social sphere, we chose questions about gay marriage, banning books with “dangerous ideas” from school libraries, and the role of government in promoting morality.
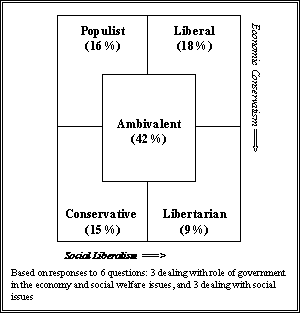
 People were sorted into the four categories based on the combination of socially liberal (or conservative) and economically liberal (or conservative) answers they gave. To be included in one of the four groups, a person needed to provide at least two answers consistent with either the social or economic dimension and at least one consistent answer in the other dimension – while also giving no more than one inconsistent answer in each dimension.
In other words, liberals tended to give consistently liberal responses to the six questions we chose, while conservatives gave consistently conservative responses. Populists, by contrast, gave conservative responses to the social issue questions but liberal responses to the economics questions. Libertarians took the opposite approach, giving conservative responses to the economic questions and liberal responses in the social issue sphere.
Based on this process, almost six-in-ten Americans fall into one of the four ideological groups; 18% are liberals, 15% are conservatives, 16% are populists, and 9% are libertarians. The remainder included people with a mixture of views, or who declined to offer opinions on several of the six questions in the test; this large non-ideological group (42%) is labeled the “ambivalents.”
Of course, the method we use is not the only way to define these groups. It’s possible to use stricter criteria that reduce the size of each of the ideological groups (and increase the size of the ambivalent group), or to relax the rules and thereby increase the size of each ideological group. It is interesting, however, that when defined in this way, the number of populists in the United States is equal to the number of political conservatives; and libertarians, though the smallest of the ideological groups, represent a substantial percentage of the population (9%).
It’s also noteworthy that liberals, by this measure, are the single largest ideological group (18%), despite the fact that when Americans are asked to describe themselves ideologically, conservatives outnumber liberals by about 2 to 1.
The Demography of Ideology
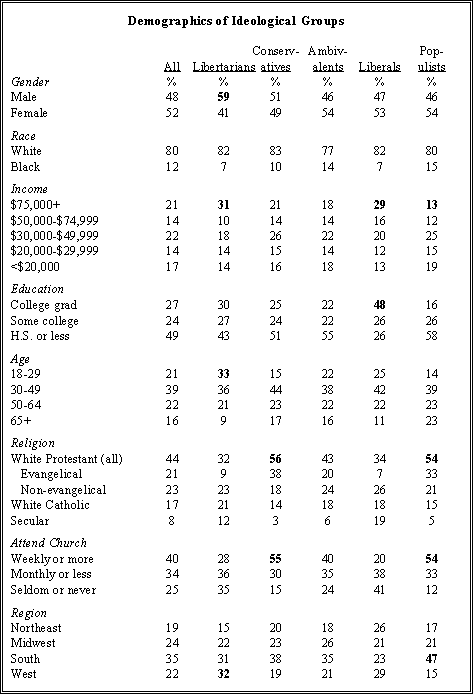
People with consistent ideological views do not differ demographically in dramatic ways from the ambivalents, though as a group the ideologues are somewhat better educated than the ambivalents. But the ideological groups differ from each other on certain characteristics.

Libertarians are much more likely to be male (59%) and young (33% are under age 30) than are any of the other groups; they are also more numerous in western states. Liberals are far better educated than other groups (48% college graduates, compared with an overall average of 27%). By contrast, populists are less educated, with just 16% holding college degrees, and nearly half of them live in the south. They are less affluent as well: only 13% live in households with incomes of $75,000 or higher – 8 percentage points lower than the national average.
Evangelical Protestants are much more common among the ranks of conservatives (38%) and populists (33%) than among the other groups. Conservatives and populists also attend church at higher rates than do members of other groups (majorities say they attend religious services at least once a week, compared with 28% of libertarians and a mere 20% of liberals).
Values and Views
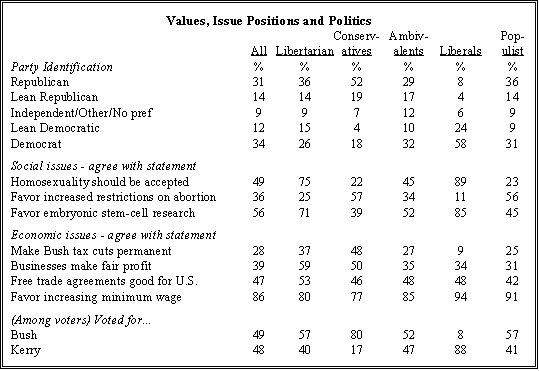
There is a close, but not perfect, correspondence between ideology and partisanship for conservatives and liberals. Conservatives favor the Republican Party (71% identify with or lean toward the GOP), while liberals favor the Democrats (82% identify with or lean toward the Democratic Party).
Not surprisingly, libertarians and populists fit much more uneasily into the two major political parties. Both groups tend to favor the GOP, but are much more evenly divided between the two parties than are either liberals or conservatives. Of all of the groups, ambivalents are the most evenly divided between the parties (46% favor the Republicans and 42% favor the Democrats), and the most likely to eschew affiliation with either party (12% say they are independent, affiliate with a third party, or have no partisan preference).

On questions relating to social issues, the groups divide very much as we would expect, based on the way they were created. Nearly all liberals (89%) say homosexuality is a way of life that should be accepted by society, and three quarters (75%) of libertarians agree. But only 23% of populists and 22% of conservatives share this view. Similarly, 57% of conservatives and 56% of populists think there should be more restrictions on abortion, compared with only 25% of libertarians and just 12% of liberals.
Opinions on embryonic stem cell research are less clear-cut. Most liberals (85%) and libertarians (71%) favor such research, but so, too, do 45% of populists and 39% of conservatives. On each of these issues, the opinions of ambivalents fall somewhere between those held by libertarians and liberals on the one hand, and conservatives and populists on the other.
Views on economic issues show less distinctiveness across groups. More conservatives than others favor making the Bush tax cuts permanent (48% of conservatives favor permanency compared with 37% of libertarians, 25% of populists, 27% of ambivalents and 9% of liberals). And libertarians (at 59%) and conservatives (at 50%) are more apt than liberals (34%), populists (31%) and ambivalents (35%) to say businesses make a fair amount of profit. But for the most part, the differences among groups on economic issues are less dramatic than they are on social issues. The range of concurrence with the statement that free trade agreements have been good for the U.S., for instance, is a mere 11 points (ranging from 42% among populists to 53% among libertarians). And large majorities of every group (including 80% of libertarians) favor increasing the minimum wage.
Not surprisingly, John Kerry won an overwhelming share (88%) of the vote among liberals in the 2004 election, while George Bush enjoyed a similar level of support (80% of the vote) among conservatives. What is surprising, however, is that Bush also won a majority of the vote among all of the other groups. Nearly six-in-ten libertarians and populists and 52% of ambivalents say they chose Bush over Kerry in 2004.
Not a Bipolar Nation
While dividing the public into liberal and conservative camps may be useful for helping to simplify and understand American politics, this analysis shows that most Americans defy such easy categorization. Only about a third of the public holds consistently liberal (18%) or consistently conservative (15%) opinions on political issues. Nearly one-in-four Americans are ideologically consistent in their outlook, but don’t fit the liberal or conservative labels (9% are libertarians who consistently oppose an active government in both the economic and the conservative spheres, and 16% are populists who consistently favor an active role for government). And the large plurality of Americans (42%) are in the ambivalent middle, and do not hold ideologically consistent views at all.
This variety of ideological viewpoints in the public, combined with the large number of Americans who are not ideological at all and the institutional factors that favor a two-party (as opposed to a multi-party) system, lend a pragmatic flavor to American politics. Pew’s 2004 political typology, for instance, which sorted the public into nine groups based on their political values, beliefs and partisan affiliation, demonstrates that substantial portions of the major partisan coalitions co-exist only uneasily with their co-partisans. Indeed, the very names attached to some of the typology groups (such as the Republican leaning “Pro-Government Conservatives,” who make up 9% of the public, and the Democratic leaning “Conservative Democrats,” who account for 14% of the population) reflect the ideological tensions that exist even within political alliances.
In short, while the influence of ideas in U.S. history and American politics should not be underestimated, the impact of ideology is less clear. Far from being an ideologically bipolar nation divided between liberals and conservatives, the U.S. is much more accurately described as an ideologically multipolar polity, with many ambivalent non-ideologues occupying a large middle ground.


