Pew Research Center has a long history measuring the public’s knowledge about issues, whether in specific domains like science or religion or in a broader way, such as what people are following in the news. Most recently, we sought to measure what adults in the United States know about international issues including geography, foreign leaders, institutions and more. In this post, we’ll detail how we set about creating a relatively small, 12-question survey scale to capture the public’s knowledge about such an enormous topic.
Coming up with the questions
This project began nearly a year ago when we compiled a list of knowledge questions the Center and other research organizations had previously asked about international affairs. We knew we wanted to keep some trend questions so we could evaluate if Americans knew more or less than they did in the past. But we also knew we’d need to draft lots of new questions, which we did with an eye on the diversity of questions, our substantive reporting goals and the feasibility of the project.
Diversity of questions
When measuring knowledge, researchers are sometimes interested in the public’s awareness of a specific fact because that knowledge might affect whether and how people develop an attitude about the broader topic. But since it’s not feasible to ask about every topic we are interested in, knowledge measures are commonly chosen to serve as indicators of an underlying propensity to learn about an issue or the existence of underlying knowledge about a general topic area.
Viewed this way, the goal of a good set of knowledge questions should be to ask about topics that are representative of the broader set of things we are interested in, and to do so in a way that fairly and accurately captures whether people know something or not. The hope is that, collectively, the items serve as an accurate sampling of what people know.
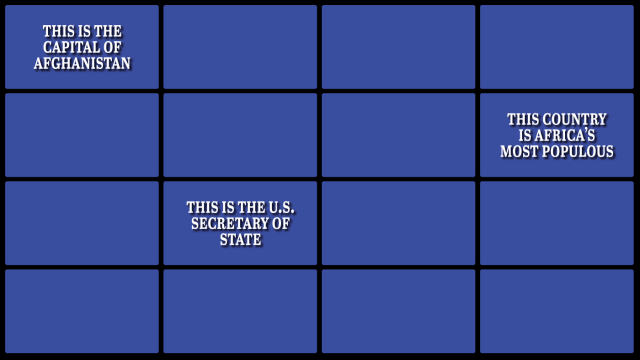
Since it’s impossible to cover the full spectrum of international knowledge in only 12 questions, we strove instead to make sure we had at least one question about each major continent. We also wanted to ensure that we had some questions dealing with geography, some with leadership, some with international organizations and some with other topics — hopefully minimizing the chance that if someone knew the answer to one question, they would also know the answers to most of the questions. To help keep people’s interest in the survey, we also varied the question style between image-based questions and text-based questions.
Substantive reporting goals
While measuring public knowledge is interesting for its own sake, it’s particularly interesting to look at the interplay between people’s knowledge and their attitudes. In a recent Pew Research Center survey, for example, we measured Americans’ attitudes toward Russia and NATO amid the ongoing crisis in Ukraine. But we also wanted to understand whether those attitudes varied depending on whether people knew that Ukraine is not a member of NATO.
Similarly, in a recent report about Americans’ attitudes about China, we wanted to understand whether those who knew more about Xinjiang — the Chinese region with the country’s highest per capita population of Muslims — felt differently about human rights in China than those who knew little or nothing about Xinjiang.
Feasibility
While developing our knowledge scale, we also needed to have an eye on real-life considerations.
One such consideration: Will the answer to a particular question remain true throughout the survey field period? A survey might take place during an election cycle, for example, so asking about a particular world leader may not make sense if that leader won’t be in power in a few weeks’ time. For this project, we asked Americans a trend question about who the prime minister of the United Kingdom is — an inquiry that felt like a sound choice until calls mounted to remove Boris Johnson from office. (In the end, Johnson stayed in power and the question turned out to be one of the most useful in our scale.)
Another consideration: Will the answer to a particular question appear elsewhere in the survey, potentially giving it away? We recently asked Americans to rate their confidence in several world leaders, including Chinese President Xi Jinping. It therefore would have been imprudent to ask, further down on the same questionnaire, “Who is the Chinese president?”
Measuring the scale: Item response theory
Having developed a number of feasible knowledge questions, we next moved to pretest them to assess whether, in addition to meeting the above criteria, they were also a reliable measure of a single underlying concept: international knowledge.
There are certainly people who are very knowledgeable about a particular country or region due to personal ties, employment or other idiosyncratic factors. But the more common pattern is that people pay attention to international news and issues in a more general way, in part because of the interconnectedness of the world today. Accordingly, we sought to measure this kind of general international knowledge, rather than focusing on a particular country, region, organization, conflict or other topic.
We wanted our scale to include questions that did a good job of distinguishing (or “discriminating”) between different groups of people — questions that knowledgeable people would be likely to answer correctly and that less knowledgeable people would be likely to miss. That said, people vary considerably in their underlying level of knowledge, which means that the ability of a question to distinguish one set of people from another is a function of its difficulty. A question that is very difficult may help us identify the more knowledgeable people, but it won’t help us make distinctions among the less knowledgeable.
To help with this problem, we used a statistical approach called item response theory to test our questions. This method generates a measure of difficulty and discrimination for each of the items in the survey. As we frequently do when working on questionnaire design, we conducted our pretests with nonrepresentative, online surveys and, following each iteration, looked at four statistics — including difficulty and discrimination — to see how we could improve our scale, if at all:
- Difficulty. The difficulty of an item is the point at which 50% of respondents answer the question correctly and 50% do not. Given that our goal was to create a test that the average American could take — and that gave us information about those with low and high levels of international knowledge — we knew the difficulty of each question needed to vary but wanted the items to create a scale with a normal distribution centered right around zero.
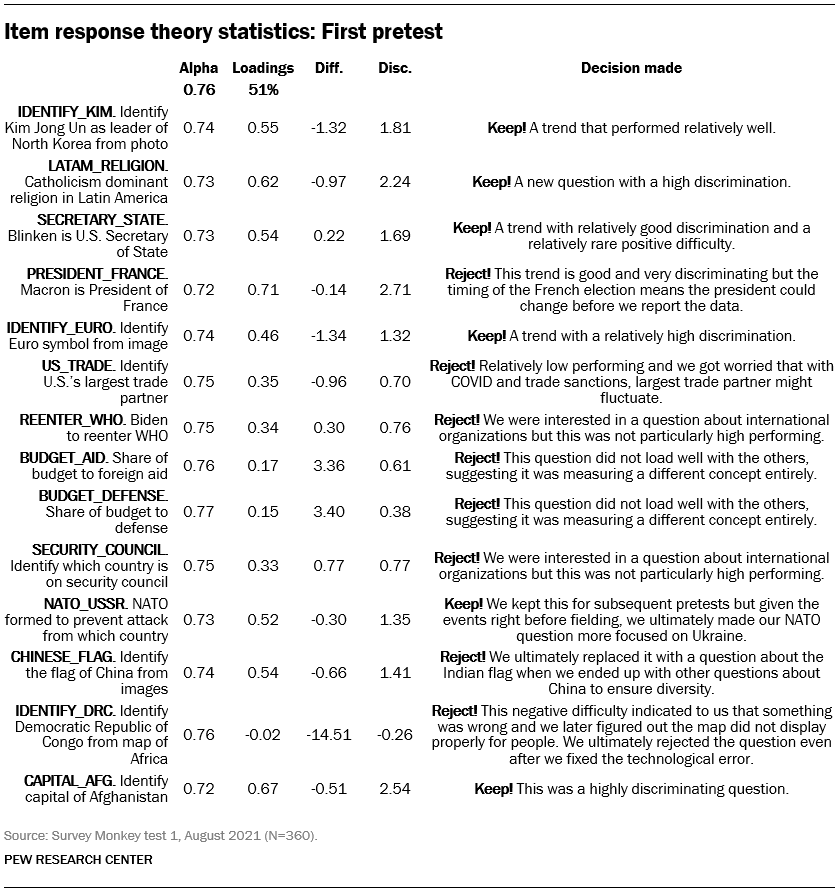
- Discrimination is the relationship between a respondent’s knowledge and their likelihood of getting a question right. A high discrimination value means that the more international knowledge someone has, the more likely they are to answer a question correctly. A negative discrimination value suggests that the more someone knows, the less likely they are to get answer a question correctly. This should hopefully be rare and would be cause for concern when designing a knowledge scale. But we did find one example of it during our pretesting, when we asked people to identify the Democratic Republic of Congo on a map and later found out the map did not load properly for respondents. Those who got it right could only have been guessing because they saw a blank space rather than a properly formulated map and question.
- Cronbach’s alpha is the degree to which knowledge scale questions are internally consistent or “hang together.” A high Cronbach’s alpha means that getting one question right is related to getting other questions right, while a low one means that getting one question right has no bearing on getting others correct. We looked both at the overall alpha and the scale’s reliability, as well as whether the Cronbach’s alpha improved with the omission of any single item. If that were the case, it would mean that the overall scale could benefit from the removal of that item.
- Factor loadings. Since we wanted our scale to measure one thing — international knowledge — we wanted to ensure that most of our variance could be explained by a single factor. If that turned out to be the case, we would have more confidence that our scale was unidimensional. If, instead, we found multiple factors that were equally strong, we would be concerned that we might be measuring distinct concepts. For example, if our visual questions (those including maps and pictures) created one factor that the other questions did not, we might be worried that we were measuring visual acuity separate from international knowledge. Alternatively, if the questions related to geography created one strong factor that the other questions did not, we might be concerned that “geography” is a separate thing from international affairs and cannot be thought of as part of the overall international knowledge scale.
After conducting each of three pretests, we worked to craft new questions to improve the statistical performance of our scale while still keeping in mind the need for diverse questions that met our substantive reporting goals. Typically, this meant replacing or tweaking three to four questions each time we ran a pretest. Below, as an example, is a chart of these statistics from our first pretest and some thoughts we had about each of the items. The scale we ultimately developed included many questions from our first pretest, but we were able to iteratively improve upon it through repeated pretesting.

Next steps
In the end, we were relatively pleased with our scale’s performance and deployed it on the Center’s nationally representative American Trends Panel.
As we hoped, the scale performed well, just as it had done in pretesting: We found a Cronbach’s alpha of 0.83 and that 67% of the variance could be explained by a single factor. We also found that our overall measure of Americans’ international knowledge was quite predictive of their attitudes toward foreign countries and leaders, among other things.

Given the interesting results, we’d love to replicate such a study internationally, exploring not only how levels of international knowledge vary by country, but also how the relationship between knowledge and attitudes might vary. Due to the complexity of measuring knowledge in just one country, however, we know this would be a massive undertaking, especially since it’s not clear that the types of facts we asked about should be equally well known in different countries.
For example, it could arguably be more important for Americans to know the U.S. secretary of state by name than for someone in a foreign public to be able to identify Antony Blinken. Similarly, it might not be important for someone in Japan or South Korea to know about NATO or the U.S.-Mexico-Canada Agreement (USMCA), since both might be more pivotal knowledge for an American or Canadian. Still, given our interest in comparative international research, we remain eager to explore the idea in future surveys.


