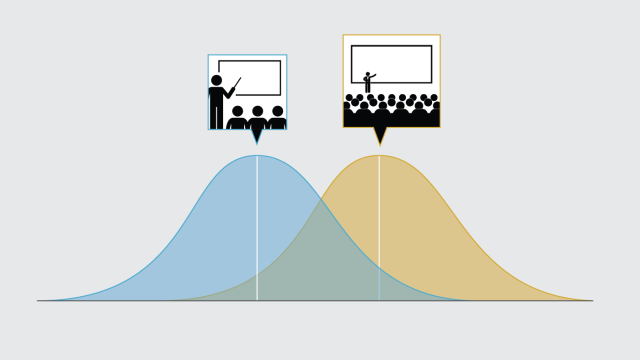
Every year, prospective college students and their parents pore over university statistics, trying to gauge which school will be the best fit. One consideration — often highlighted on university websites, in articles and academic literature — is average class size. But the average class size at a university conveys little about the experience of the average student there. Unless all classes have the same number of students, the average student will always experience larger classes than the school’s average, simply because large groups have more people in them. This is known as the “class size paradox.”
The class size paradox can come up when pursuing many different research questions, including in a recent Pew Research Center study about household living arrangements around the world. The study presented detailed information about how household sizes and types (extended family, solo, polygamous, etc.) vary by country, region, major religious group, age and sex. There were dramatic differences between the average size of a household and the experience of the average individual, especially in places where big households are common.
To highlight these differences in the context of household living arrangements, consider a hypothetical example of next-door neighbors living in two homes. One home contains a person who lives alone. The other houses a family of nine. The average household therefore contains five people (10 people in two homes). But since nine out of 10 of these people live with more people than the household average, this figure fails to capture the typical experience in these two homes. In this example, the average individual lives with 8.2 people. (Nine individuals, each living among nine people, plus one solo person, is 9+9+9+9+9+9+9+9+9+1, or 82 divided by 10 people.)
In our recent study, we made the unusual choice to present all results from the perspective of individuals, rather than households. Similar reports from other organizations typically show household-level statistics (unless it is necessary to use individual-level data, such as when describing the living arrangements of children). Our approach made our results different from those reported by other organizations and government agencies, but it allowed us to show comparable statistics throughout the report and accurately describe how the lived experiences of individuals vary around the world.
In this post, I’ll share more specific examples of the class size paradox in household living arrangements. These examples will underscore how much the perspective researchers choose can matter.
Households are larger at the individual level than at the group level
In our real-world data on household size around the world (based on standardized and aggregated censuses and surveys from 130 countries), the disparities are smaller than in the two-home example I mentioned above, but still meaningful. The difference between household size as experienced by the average person in the world (4.9 members) is one whole person more than the size of the average household (3.9).

Discrepancies between the average household size and the average experienced by individuals tend to be largest in countries where it’s typical for many people to share a home. The average dwelling in Gambia, for example, is home to 8.3 people — the figure generally found in demographic reports. However, the average Gambian lives in a household of 13.8 people. The experience of sharing a home with seven relatives is qualitatively different from sharing a home with over a dozen other people, and that experience can only be captured at the individual level.
Households in Guatemala are usually smaller; the average number of people per household there is 4.9. But almost 70% of Guatemalans live in households with at least five members, so the average person lives in a home with a family of just over six. In the United States, the average residence contains 2.5 individuals, but the average person lives in a household of 3.4 people.
Differences by household type
We also found striking differences in the shares of people who live in different household types. For example, 26% of households in the 130 countries contained extended families, but 38% of people in the same countries live in extended family households, making this the most common living arrangement in the world. On the other hand, solo households make up 15% of homes globally, but only 4% of people live alone. This is because solo households are small, consisting of one person by definition, while extended family households often contain several people or more.

Turning back to Gambia, where households are especially large, about 15% of all households contain a polygamous family — generally speaking, two or more wives with their children and shared husband. Since such families tend to be large, the likelihood of an individual Gambian to live in a polygamous household is much higher than what the household-level figure would suggest. In fact, 30% of Gambians live in polygamous families.
In Guatemala, slightly fewer than a third of houses belong to extended families. But living in an extended family is the most common arrangement for Guatemalans, with 40% of people going home to aunts, grandparents or other relatives besides their partners or children. The mismatch between households and individuals appears in the U.S., too. More than a quarter of dwellings in the U.S. hold one person living alone, but only 11% of people in the U.S. live on their own.
Different situations call for different metrics
Both individual- and group-level perspectives can be informative in demography and other kinds of studies, but researchers should choose their level of analysis with care. For example, when planning something like aid distribution, it makes sense to calculate how many individuals reside in the average house, but this statistic is uninformative for those who are interested in the typical experiences of the people inside. Similarly, the number of students in an average class is important information for administrators planning to add a new building to a university campus, but that figure won’t tell you whether future students should expect to attend classes in large lecture halls or small seminar rooms. For researchers, it’s useful to consider both approaches and settle on the one that answers your research question in the most appropriate and informative way possible.


