(Related post: What different survey modes and question types can tell us about Americans’ views of China)
One of the most valuable contributions that public opinion researchers can make is placing current attitudes in historical context. What is the trajectory of public opinion on a key issue? Are different groups in society diverging in their views? To provide that context, one of a survey researcher’s most treasured tools is a robust trend measure — a question that has been asked the same way in the same format over time, allowing us to speak confidently about changes in opinion.
Pew Research Center’s U.S. politics work sits on a foundation of more than three decades of opinion surveys, including many questions we’ve steadily tracked over time. These long-term trends have allowed us to measure important changes in the American political landscape, including how party identification has shifted; growing partisan divides across numerous domains, including in the values Republicans and Democrats hold; substantial increases in support for legalizing the use of marijuana and for same-sex marriage; the public’s evaluations of presidents; how members of the two major parties view each other — and much more. Sometimes, as in the case of public trust in the federal government, these trends date back even further.
The Center’s transition from conducting surveys on the telephone to conducting them on our online American Trends Panel (ATP) presents challenges to analyzing trends over time. It is well established that some questions get different results when asked online than when on the phone — a phenomenon known as a “mode difference” or “mode effect.”
Our new report on Americans’ political values is largely based on a survey conducted in September among nearly 10,000 U.S. adults on our online panel. It includes a substantial number of questions that have decades-long phone trends. Several of these questions have been the backbone of many over-time analyses, including our research on the increasing divide in political values.
For this reason, we fielded a roughly contemporaneous phone survey in September that included many of these same long-term trend questions. Conducting the same survey online and on the phone allows for a comparison of differences between the two, and places the current panel estimates in the context of phone data.
While the method of interviewing is the primary difference between the telephone and online surveys, it is not the sole difference. There are sampling and modest weighting and compositional differences between the ATP and random-digit-dial phone surveys. However, analysis of those differences suggests that their impact on estimates is negligible in nearly all cases.
In this post, we’ll walk through a few examples to evaluate whether the phone and online surveys yield similar or different estimates of public opinion today, both overall and among Republicans and Democrats. In some cases, we’re able to examine over-time trends on both the phone and online, allowing us to see if opinion is moving the same way in both modes.
There is no single pattern: Some questions have nearly identical results online and the phone, while results differ on other questions. Where differences do appear, some are largely attributable to smaller shares of respondents declining to answer the question, while others are more substantial — perhaps picking up on a social desirability effect. Even so, as we have noted in prior research, there is not a consistent ideological tilt: In some cases respondents offer somewhat more liberal responses on the online survey (as in the case of views about the fairness of the economic system), while in others the online survey responses are more conservative (as in views about the impact of immigrants on the country).
The four examples in this post provide examples of the types of differences we see. Several more are discussed at the end of relevant chapters in our new report.
The partisan gaps are largely similar in online and phone surveys. On the 10 political values Pew Research Center has asked about consistently on the phone since 1994, the average percentage-point difference between Republicans and Democrats is slightly larger online (39 points) than in the contemporaneous phone survey (36 points).
Views of government efficiency similar in both modes
The graphic below illustrates one of the trend questions we analyzed — whether the government is seen as “almost always wasteful and inefficient” or whether it “often does a better job than people give it credit for.” It’s a question that has been asked in the Center’s phone surveys since 1994, and the phone trend shows that overall public sentiment about government efficiency has been generally stable for more than a decade, with narrow majorities consistently saying that they view the government as wasteful and inefficient.
Over this period Republicans have generally been more critical of government than Democrats, and these views tend to move somewhat in reaction to the party holding the presidency (with partisans tending to be more critical of government when the White House is occupied by someone from the opposing party).

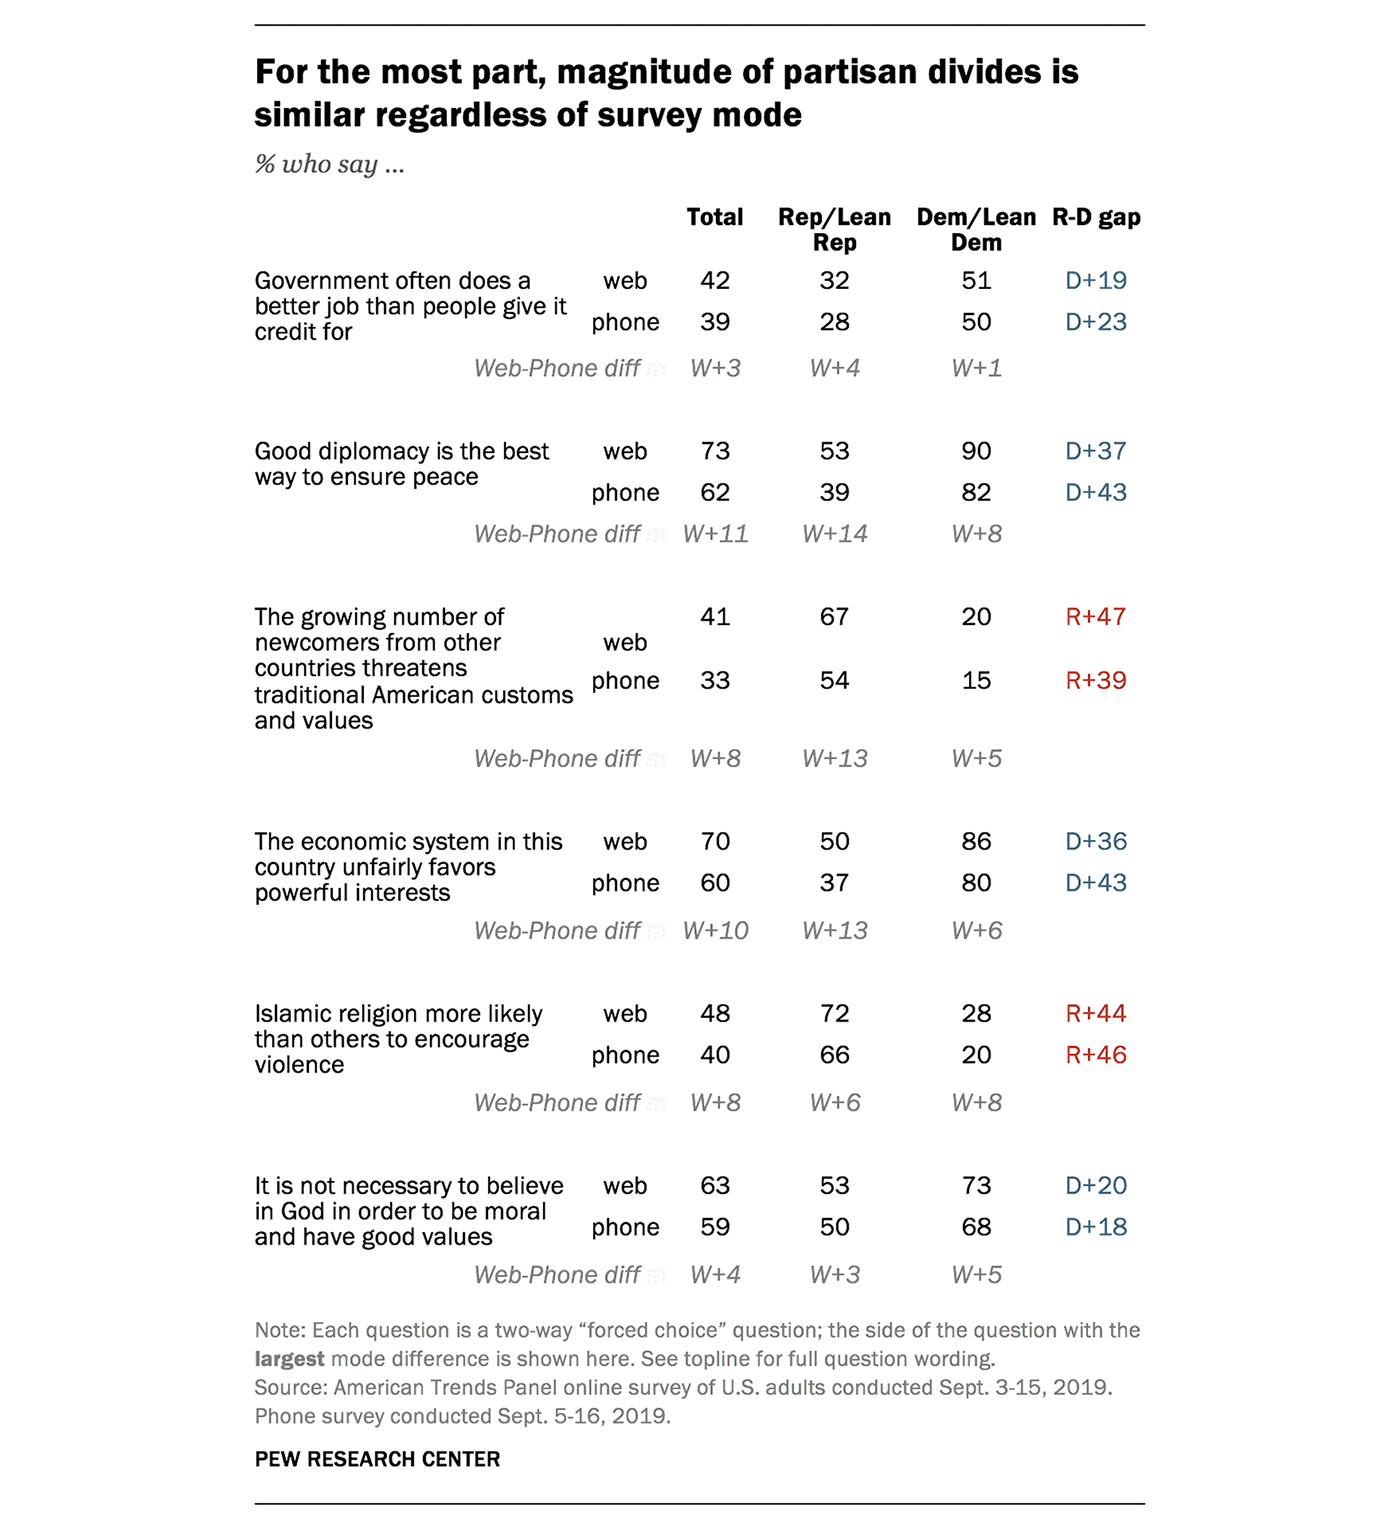
On this question and a few others, including opinions about environmental regulation, there is little difference between the phone and web surveys. In the online survey, 56% say government is almost always wasteful and inefficient, while 55% say this in the phone survey. And while 42% say online that government often does a better job than people give it credit for, 39% say this on the phone. In the online survey, there is a 21 percentage point partisan gap in the shares viewing government as wasteful and inefficient (68% of Republicans and Republican-leaning independents vs. 47% of Democrats and Democratic leaners), largely identical to the 23-point gap in the phone survey.
Mode differences in views of national security, immigration, economic fairness
Yet there are significant differences between phone and online survey estimates on other questions. One example is a measure with a 25-year trend on the phone, and a shorter two-year trend online: Is the best way to ensure peace through military strength or through good diplomacy?
On this question, there is little difference between the phone and online surveys in the shares who say military strength is the best way to ensure peace, and the breakdown of partisans’ views is nearly identical in both formats. But Americans overall are significantly more likely to say diplomacy is the best way to ensure peace in the online survey than on the phone (73% vs. 62% of the public says this in the current surveys).

This corresponds to differences in volunteered responses: Just 1% of respondents decline to answer the question in the online survey, while on the phone 10% either say they do not know or they volunteer an answer of “both” or “neither”). This is a commonly observed mode difference. Since online surveys are self-administered, they cannot replicate the set of “soft” volunteered responses that are often available in surveys with an interviewer.
Despite this difference, the partisan differences online and on the phone are roughly the same, and the short-term trajectories of the trends parallel one another.
A mode difference also surfaces on a question about the impact of newcomers from other countries on the United States, which we have asked in phone surveys since 2004 and on the American Trends Panel since 2015.
In the phone survey, 61% say the growing number of newcomers from other countries strengthens American society, while 33% say they threaten traditional customs and values. Online, 57% say newcomers to the U.S. strengthen society and 41% say they threaten traditional values. The share who do not have an opinion is higher on the phone than online. (As noted above, this is a common mode difference.)

Consistent with some previous research on mode effects, the differences on this question are more pronounced among Republicans than Democrats — particularly in the shares saying newcomers to the U.S. threaten traditional customs and values. In the phone survey, 54% of Republicans express this view; on the ATP, 67% say newcomers from other countries threaten American values. Among Democrats, differences are far more modest (15% say newcomers threaten U.S. values in the phone survey, vs. 20% online).
These results make it difficult to directly compare the long-term phone trend estimates to the online estimates for this question. However, because we have asked this question on ATP surveys since the spring of 2016, we can see that over the past three years the phone and online surveys do show similar trends, both overall and within the two party coalitions: Increasing shares say newcomers strengthen the country and declining shares say newcomers threaten the country.
The nature of mode differences — as well as the direction of those differences — can vary. For instance, Americans are more likely to characterize the economic system in this country as one that “unfairly favors powerful interests” in an online survey (70%) than a phone survey (60%), with a mode difference seen among both Republicans and Democrats.

This question also provides a good example of how analysts need to be cautious in interpreting survey differences when there has been a mode shift. As the phone trend illustrates, public attitudes about the fairness of the U.S. economic system have changed little in recent years.
The phone trend also suggests that, to the extent there has been a shift, people are slightly less likely to say the system unfairly favors powerful interests today than in 2016 and 2017 (60% say this in the phone survey today, compared with 65% in the summer of 2017). The 70% saying this in the online survey today is higher than in phone surveys in the past — but the mode comparison suggests this is a difference solely attributable to mode of survey, not a shift in public opinion.
The extent of the mode differences varies from negligible (as in the case of views about government waste and inefficiency) to more sizable (views of the fairness of the economy, immigrants).
Yet even in cases where there are significant mode differences in these values questions, they tend to be similar across groups. As a result, partisan gaps in opinion on these long-standing values trends are similar across the two modes for most questions.

In fact, for 12 of the 18 forced-choice values questions in this survey, the difference in the partisan gap on the web and the phone is 5 percentage points or less, while the largest difference is 10 points.
And on the 10 political values items asked together in eight Pew Research Center surveys since 1994, the average partisan gap is only somewhat different in the phone survey (36 percentage points) compared with the American Trends Panel (39 points). This gap is unchanged over the last two years in phone surveys, but it remains substantially wider than it was in the past.


