
Every two years, Pew Research Center publishes State of the News Media, a collection of fact sheets that examine key audience and economic indicators for a variety of sectors within the U.S. media industry. The analysis relies primarily on external, non-Pew Research Center data for metrics including TV ratings, website traffic and advertising revenue.
Using data from outside organizations has some advantages, but also poses challenges. First, we must first carefully vet the methodology behind the external data. That’s the case for all kinds of data, but especially for media industry data, which is not always intended for public consumption but rather to inform news organizations’ advertisers, investors or donors. The data is also often extremely granular, meaning that there may be some work involved in generating full-year, industry-wide figures for particular indicators. It may be presented in a way that complicates the comparisons we want to make. And because we do not control this data, it can always disappear from the public domain or change in a way that can make it challenging to continue our longstanding trend analyses.
In other words, we must constantly make adjustments to provide the data on an ever-changing U.S. media landscape. But some years prove more challenging than others. In this year’s just-released research, one of the biggest challenges concerned data on U.S. newspaper circulation.
Estimating newspaper circulation
To estimate total print and digital circulation for newspapers in the U.S., Pew Research Center relies on historical data from Editor & Publisher as well as more recent data from the Alliance for Audited Media, or AAM.
The Editor & Publisher data, which was originally posted on the website of a newspaper industry group, includes newspaper circulation estimates from 1940 to 2014. We use these estimates as a starting point. Then, to determine how newspaper circulation has changed in more recent years, we use data from AAM, which collects subscription figures for many — but not all — U.S. daily newspapers. (It’s up to publishers to subscribe to the service and report their data, which is then subject to an audit.)
Since the AAM data is not all-inclusive, we do not rely on it to estimate overall newspaper circulation figures after 2014. Instead, we use it to calculate a percentage change from one year to the next and then apply that percentage change retroactively to the data reported by Editor & Publisher through 2014. Here’s a look at the long-term trend using this approach:
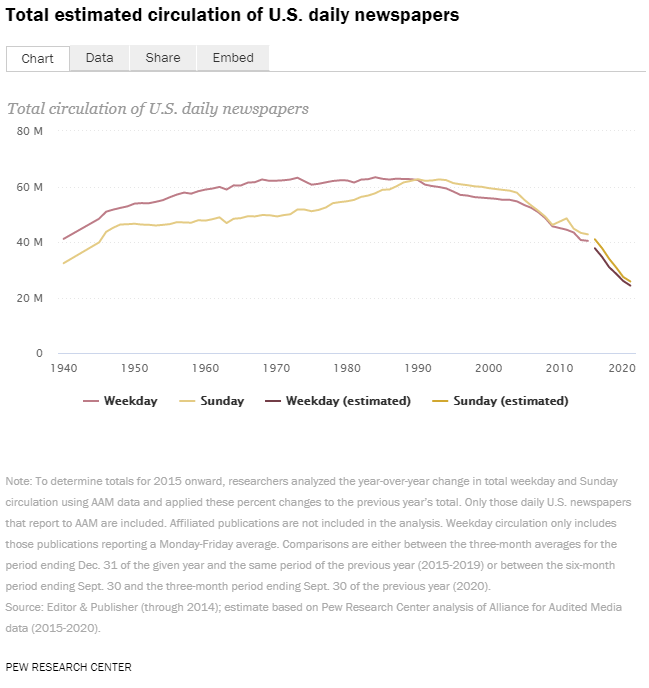
One important caveat about the AAM data is that three national papers — The New York Times, The Washington Post and The Wall Street Journal — do not fully report their digital circulation to AAM, even though they do report their print circulation.
If the digital circulation patterns across all newspapers are similar, we wouldn’t necessarily need the data for these three national papers to generate a valid estimate, since we are using the AAM data only to calculate a percent change, not to provide raw numbers. But given these organizations’ huge footprint online and recent growth in digital subscriptions, there are good reasons to think this is not the case, posing some obvious problems for our analysis. And since the data comes from an outside source, we can’t simply ask these papers to report their digital circulation to AAM. If the data is not there, we must find some way to work around it.
Fortunately, for two of these three newspapers, we do have a piece of data that’s related to digital circulation: the total number of digital-only subscribers to the Times (from SEC filings) and digital subscribers to the Journal (from audited statements on the Dow Jones website). (The Post, as a privately held company, does not publicly report their digital subscription numbers, although data will emerge sporadically in press reports.) While digital circulation figures are intended to capture the number of people who use their login to read a paper’s content online and to set rates for advertisers, digital subscription figures refer only to the number of people who pay for a paper’s content, including those who may not necessarily read it every day.
Of course, we can’t simply treat digital subscription numbers the same as circulation figures. But we use the digital subscription figures for the Times and the Journal to do a kind of “thought experiment” about what they may say about circulation trends more broadly. Here’s how we described this thought experiment in our 2019 study:
…using only the AAM data, digital circulation in 2018 is projected to have risen, with weekday up 6% and Sunday up 8%. According to the independently produced reports from The New York Times and The Wall Street Journal, both companies experienced substantial gains in digital subscriptions in the past year: 27% for the Times and 23% for the Journal, on top of large gains in 2017. If these independently produced figures were included with the AAM data in both 2017 and 2018, weekday digital circulation would have risen by 17%. The addition of these figures would also change the overall picture for combined print and digital circulation. The digital boost driven by these two large, national brands would still result in an overall drop in circulation year over year, but a smaller one: Overall weekday circulation would have fallen by 1% in 2018 rather than 8%.
In other words, including digital subscription figures for the Times and the Journal would cause our estimates for digital and overall newspaper circulation to change substantially. That said, it was heartening to see the overall trend move in the same direction, with digital circulation rising, but not enough to make up for a decrease in print circulation, resulting in a continued decline for circulation overall. And though omitting these papers’ digital data seemed to be biasing our estimates downward, other aspects of our methodology are likely biasing circulation figures upward. Papers that don’t report their circulation at all to AAM, for example, are likely in more dire straits than those that do, since such reporting requires both monetary and staff resources. If our estimate landed somewhere in the middle, then, we would seem to be in good shape. Then came 2020.
The challenges of 2020
Looking back, 2020 would have been an anomalous year for newspaper circulation no matter what, given the coronavirus outbreak and its impact on Americans’ news habits and daily routines. AAM also changed their reporting period in 2020, with newspapers providing data twice a year instead of quarterly. But for our analysis, the lack of valid digital circulation data for these three national papers became a particular headache.
Using only the AAM data — which, again, omits digital circulation from these papers — total newspaper circulation in the U.S., both print and digital combined, fell 6% in 2020. Digital circulation rose 27%, but not enough to make up for the 19% decline in print-only circulation.
For their part, the Times and the Journal saw huge growth in digital subscriptions in 2020: 50% in digital-only subscriptions to the Times and 29% in digital subscriptions to the Journal. If this data were included with the AAM data in both 2019 and 2020, weekday digital circulation would have risen by 38% — a larger change, but in the same direction.
Unlike previous years, however, including the Times and the Journal would have produced a different conclusion for total newspaper circulation. Incorporating digital subscription growth from both outlets, total weekday circulation for U.S. newspapers would rise by 10%, not fall by 6%, as is the case when looking strictly at the AAM data. This is in part because of the sheer volume of digital subscribers those two papers have captured: 2 million for the Journal and 6 million for the Times as of the three-month period ending in September 2020. As of November 2020, the Post was reportedly nearing 3 million digital subscriptions. Based on our estimates for total circulation, this alone would account for about a third of all newspaper circulation in the U.S. last year.
The chart below shows estimated total weekday circulation using just the AAM data and the larger figures when subscriber numbers from the Times and the Journal are included:

Again, these are two very different ways of measuring audience size. Digital subscribers (the numbers we get from the Times and the Journal) capture those who have paid for a subscription. Digital circulation, as measured by AAM, captures those who either paid for the digital edition or accessed one of the publication’s digital platforms to qualify the circulation unit (i.e., count as circulation). If any of these subscribers did not read the paper online every day, then the circulation figures would be lower than the subscription figures. However, even if they are cut in half, total circulation would still have risen in 2020, suggesting that this year marked at least a temporary reprieve for the U.S. newspaper industry.
The takeaway
No matter which data source you use, 2020 was the best year for U.S. newspaper circulation in some time. Using the most conservative estimate (a 6% decline) would result in the smallest decrease in circulation since 2014, when it fell 0.7%. Using the more generous estimate that includes subscribers of The New York Times and The Wall Street Journal, circulation would see its first year-over-year increase since 1987. And, elsewhere in our fact sheet, we find that newspapers saw more revenue from circulation than from advertising in 2020 for the first time in the 65 years we have data for.
Of course, “best” does not necessarily mean “good.” If something falls continuously for decades, at a certain point it finds a floor. But it does indicate that the extremely newsy year of 2020 may have had some positive effects for newspapers.
Thought experiments aside, we decided that our estimates need to be based on apples-to-apples comparisons. So, based on AAM data, we estimate the total weekday circulation for U.S. newspapers — print and digital combined — at 24.3 million, a 6% decrease from 2019 to 2020.
This is the latest report in Pew Research Center’s ongoing investigation of the state of news, information and journalism in the digital age, a research program funded by The Pew Charitable Trusts, with generous support from the John S. and James L. Knight Foundation.


