Over the past several years, Pew Research Center has migrated much of its U.S. polling from phone to its online American Trends Panel (ATP). Data collection for the U.S. component of the annual Global Attitudes Survey — a major, cross-national study typically fielded in dozens of countries via face-to-face and phone interviews — followed suit this year.
Mindful that mode differences can affect response patterns as well as analysis of findings, we conducted a “bridge” survey in 2020, fielding the same Global Attitudes questionnaire online and by phone. While the Center has previously examined the implications of migrating online for a variety of mostly domestically oriented survey items, this was our first extensive test of how mode might affect how Americans answer foreign policy and internationally focused questions.
Our bridge survey included a total of 78 substantive opinion questions. In this post, we’ll summarize the range of percentage-point differences across all items but concentrate our analysis on response patterns to four-point scales — the most common question format on the Global Attitudes Survey. Specifically, we’ll examine how key four-point scale questions performed in terms of direction and intensity of responses, as well as rates of item non-response. Our findings underscore the importance of examining all three elements when interpreting questions and trends that have migrated from phone to online.
We should note at the outset that we confirmed that the samples for the phone and online components of the bridge survey were comparable and that the online sample matched the characteristics of a typical ATP survey wave.
Differences in attitudes by phone vs. online
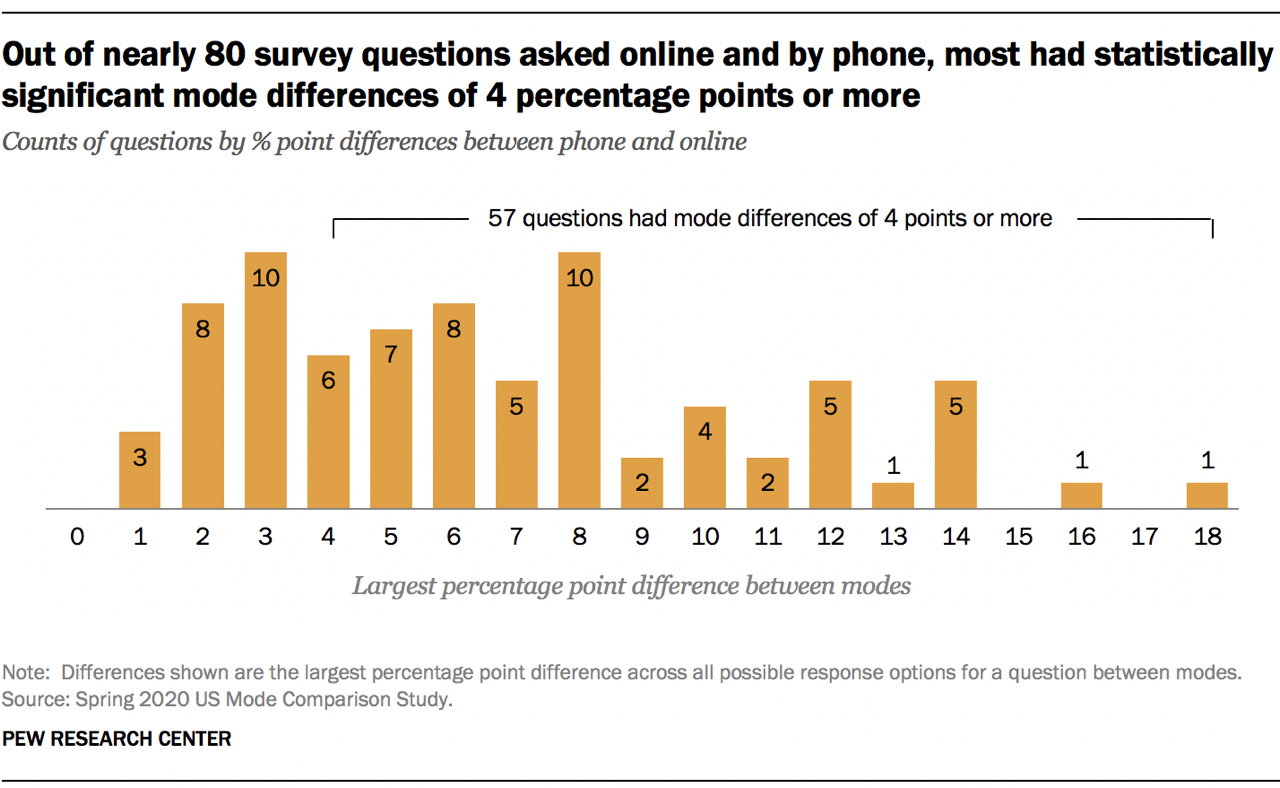
The chart below summarizes the percentage-point difference between phone and online for each of the 78 survey items included in the bridge survey. Only the single largest difference by response categories for any given question is reported. For example, let’s say 20% of our phone respondents said “yes” to a particular question, 15% said “no” and 65% said “maybe.” And let’s say 30% of our online respondents said “yes” to the same question, 10% said “no” and 60% said “maybe.” In this hypothetical, we would report the 10-point difference for the “yes” category since it’s the largest of the three.

Generally, to achieve statistical significance at the 95% confidence level, a difference of 4 points or higher is needed. When we look at the largest differences by response category, 73% of questions (57 of 78) met this threshold, including 19 survey items in which the margin of difference was 10 points or more.
Two-thirds of these double-digit differences were associated with items that employed a four-point scale. These differences by mode will factor in how we analyze and report changes in Global Attitudes findings in the U.S. To inform that analysis, we took a closer look at response dynamics across categories, focusing on key trend items that employ four-point scales.
Trend questions, four-point scales and mode effects
As mentioned above, four-point scale questions were the most common question type on the Global Attitudes bridge survey (34 items, or 44% of all substantive opinion questions) and also the question type associated with some of the largest percentage-point differences across modes. While these overall findings are instructive, we sought to better understand the response dynamics within individual questions. This meant examining responses across all categories and assessing the implications for analysis and interpretation.
Four-point scale items allow respondents to express their opinion in terms of direction (e.g., positive versus negative) and intensity (e.g., very, somewhat, not very much or none at all). Some of the Global Attitude Survey’s most consistent trend questions employ four-point scales. For example, confidence in global leaders to do the right thing regarding world affairs is measured using a four-point scale: a lot of confidence, some confidence, not too much confidence or no confidence at all.
The bridge survey posed this confidence question about six world leaders: German Chancellor Angela Merkel, French President Emanuel Macron, British Prime Minister Boris Johnson, Chinese President Xi Jinping, Russian President Vladimir Putin and then-U.S. President Donald Trump. For all of these leaders except Trump, there were double-digit differences across modes for one response category.

As the chart reveals, for non-U.S. leaders, the response category “not too much confidence” consistently exhibited the largest percentage-point differences across modes, ranging from 10 points for Putin to 14 points for Macron and Xi. The direction of difference was also consistent: online ATP respondents were more likely than phone respondents to answer “not too much confidence.” Phone respondents, in turn, were consistently more likely to give the extreme response “no confidence at all” when asked about foreign leaders, though the mode differences were smaller, ranging from 2 points for Macron up to 7 points for Xi. (Part of these differences is attributable to higher item nonresponse on the phone, which is described below.)
The response pattern diverged when Americans were asked about confidence in their own president. No single response category for Trump had a mode difference that exceeded 10 points, and the largest observed difference was in the share of respondents who answered “a lot of confidence.”
The response patterns by mode for the questions about foreign leaders were fairly common across four-point scale items on the bridge survey. For instance, there were 12 four-point questions with differences of 5 points or more in the extreme negative response category, with 10 of them showing higher rates for phone respondents than ATP panelists.
To get a better sense for what such mode differences might mean for the analysis of Global Attitudes findings, we took a closer look at response dynamics across all categories of key four-point scale trend items.
One example was the question about confidence in Chinese president Xi. As noted, ATP panelists were 14 points more likely to say they had “not too much confidence” in Xi compared to those on the phone, while those on the phone were 7 points more likely than online respondents to say they had “no confidence at all.” These are differences in intensity rather than direction of opinion. If we focus only on direction, by recoding the four categories into two (confidence versus no confidence), the single largest category difference by mode is reduced to 7 points (lack of confidence in Xi). The collapse of four-point scales to bi-modal response categories is a standard feature of Global Attitudes reporting. In this case, it highlights a meaningful consistency in the overall level of Americans’ confidence in China’s leader. Of course, the collapse of categories does not eliminate the mode effect, and the interpretation of the trend should take into account possible shifts in intensity of opinion, too.

Item nonresponse for four-point scale items is lower online than phone
The rate of item nonresponse is a frequent concern when migrating from interviewer-administered phone surveys to self-administered online polls. The ATP, like many web-based surveys, does not explicitly offer respondents the option of answering “don’t know” or “refuse.” In fact, the way ATP panelists would not respond to a question is by skipping it completely. And while “don’t know” or “refuse” options are not explicitly offered on traditional Global Attitudes phone surveys, respondents nonetheless give these answers with substantial frequency in interviewer-administered environments. The bridge survey confirmed this pattern: Phone respondents were more likely than their ATP counterparts to offer “don’t know” or “refuse” responses.
Some of the four-point scale questions that had the largest nonresponse differences across modes were the items on confidence in world leaders to do the right thing in world affairs, with four of six items having higher nonresponse by phone than online (ranging from 5 to 12 points). Another set of four-point scale questions with relatively large item nonresponse differences were those about favorability toward other countries and international organizations. Of seven such questions, six had higher nonresponse rates by phone.

Looking at the example of American attitudes toward NATO, nonresponse rates were 16 points lower on ATP than by phone. This had a substantial impact when coupled with mode differences across the item’s other four response categories, especially “somewhat favorable” and “somewhat unfavorable.” When we collapsed all four categories down to two, this lower item nonresponse rate led to both a more positive and more negative opinion of NATO among ATP respondents (5 percentage points more positive and 10 points more negative). Thus, in the case of the NATO question, the migration from phone to online was associated with a change in two directions, as well as differences in opinion intensity.
Item nonresponse across modes differed less for the question measuring U.S. favorability than for parallel items about foreign countries and international organizations. The same was true for the question about confidence in Trump, compared with other international leaders. In each case, differences in intensity, more than direction, were evident across modes.
Conclusions and further considerations
Insights from the Global Attitudes bridge survey in the U.S. suggest that issue salience — that is, how cognitively engaged the respondent is with a particular topic or issue — may play a role in response differences. For instance, we noted more striking mode effects when it came to relatively low-salience questions about foreign leaders as well as other countries and international organizations. By contrast, questions about the U.S. and its president showed more subdued mode differences with lower nonresponse. Managing how best to reliably measure low-salience issues across modes will be an ongoing challenge — especially as engagement with topics, as well as response biases, can vary across countries.
Another takeaway from this study is that the analysis and interpretation of questions and trends spanning modes benefits from paying attention to both the direction and intensity of opinion, as reflected across response categories. A single question can reveal both consistencies and differences in response patterns as we migrate the Global Attitudes Survey from phone to online. The survey’s tradition of collapsing four-point scales into dichotomous categories in its reporting may prove helpful in tracking high-level trends. At the same time, attention to how the intensity of opinion may be changing will be key to interpreting the strength and momentum of core trends going forward.


