(Related post: On a scale from 1 to 10, how much do the numbers used in survey scales really matter?)
At Pew Research Center, survey questions about respondents’ political ideology are among the most important measures in our comparative, cross-national surveys. Our recent research in Europe, for instance, explored how political polarization in the region shapes long-standing debates about domestic, social and economic policies.
To measure political ideology, our international questionnaires typically ask respondents to place themselves on a 7-point scale with two labeled endpoints (or anchors) — “extreme left” and “extreme right” — along with numbers for all of the points in between. However, some research suggests that it’s easier for respondents to understand a fully labeled scale, one that includes descriptions for the interior points as well, such as “leaning left,” “leaning right,” or “center.” In this post, we’ll describe a survey experiment we conducted to find out if two approaches to measuring the same concept align with — or diverge from — each other.
Findings at a glance
Our survey experiment was part of nationally representative telephone surveys we fielded in France, Spain and the United Kingdom in the spring of 2018. (You can read about an earlier experiment related to survey scales in this Decoded post.)
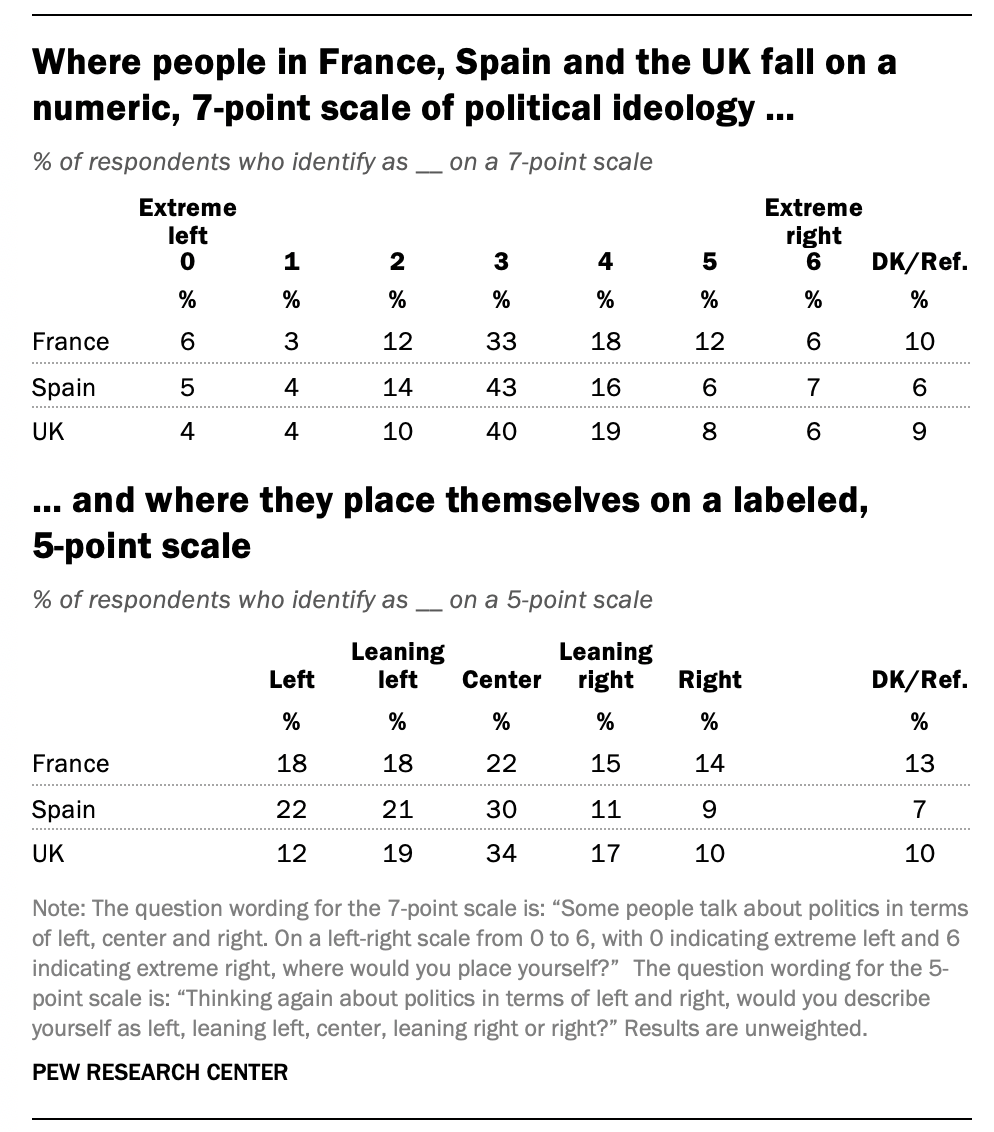
The 2018 surveys asked about political ideology in two ways. First, midway through each interview, respondents were asked the Center’s standard ideology question using a 7-point numeric response scale with only the endpoints labeled. Then, after several more questions, respondents were asked to describe themselves using a fully labeled, 5-point scale.

Here are some of the trends we observed across all three countries:
- The most common response option for both scales was the midpoint, though a greater share of respondents chose the midpoint on the 7-point scale (“3”) than on the 5-point scale (“center”).
- More respondents identified as right of center on the 7-point scale but left of center on the 5-point scale.
- Respondents were more likely to choose the endpoints on the 5-point scale than on the 7-point scale, and this was especially true for those on the ideological left.
- Levels of item nonresponse (either “don’t know” or refusal to answer) were similar using both approaches.
A closer look at France using Sankey diagrams
These aggregate numbers don’t tell the whole story. Fortunately, we can go a step further with our experimental data. By asking all respondents to answer both versions of our ideology question, we can also see how each respondent answered — or “moved” — from one question to the other.
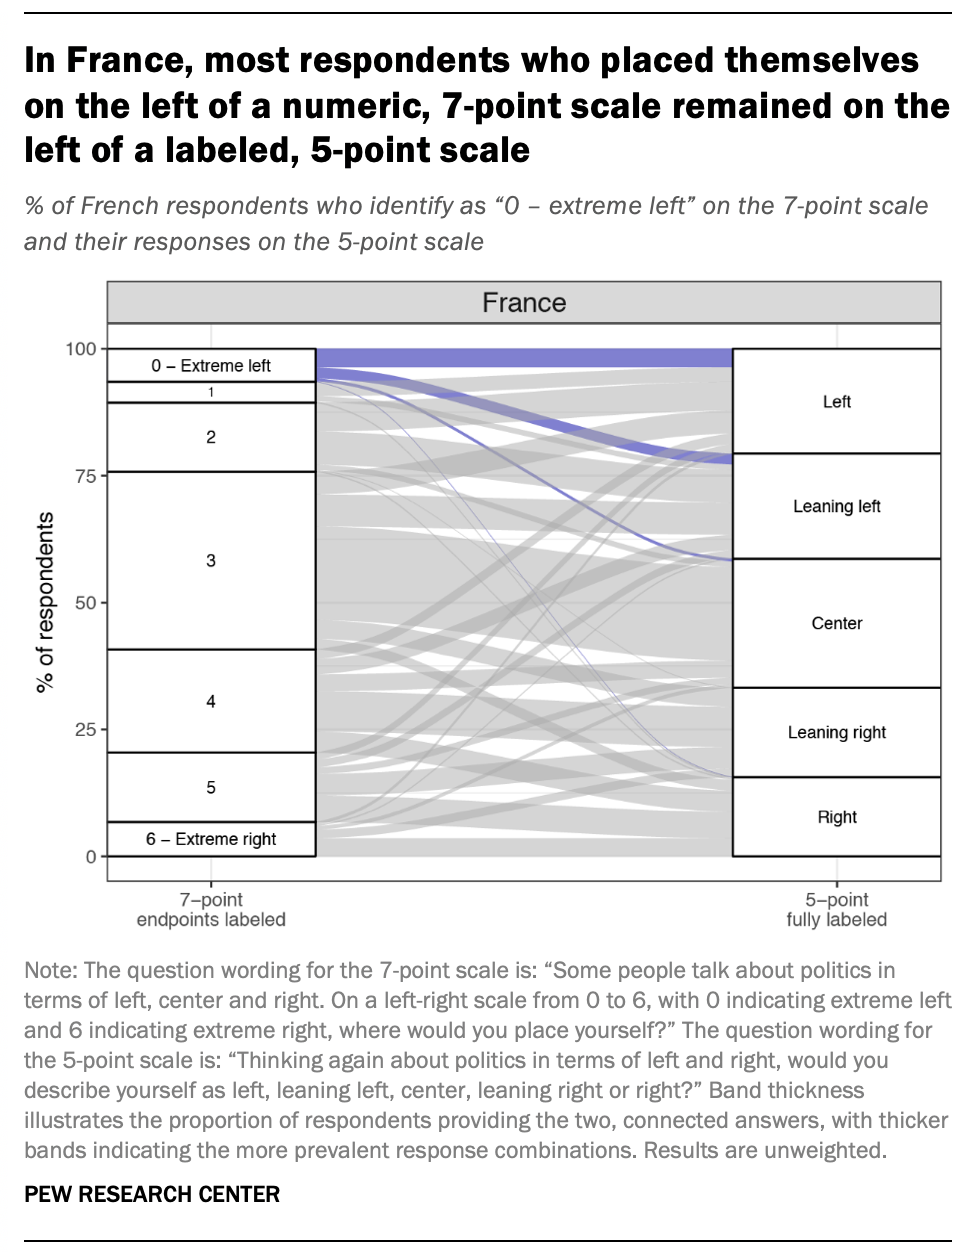
To illustrate these patterns, we created Sankey diagrams for each country using the R package ggalluvial. These graphs are a type of flow diagram that illustrate the movement from one category to the next — in this case, from the 7-point scale to the 5-point version. The band thickness in Sankey diagrams indicates the number of people taking a particular path, with thicker bands showing the more common pathways between two points on our different scales. (We should note at the outset that this part of our analysis does not include respondents who answered “don’t know” or refused to respond. It is limited to the 2,625 respondents who answered both ideology questions, including 846 in France, 935 in Spain and 844 in the UK.)

In the graph on the left, we’ll focus on French respondents who answered “0 — Extreme left” on the ideology question using the 7-point scale. Of the 55 French respondents who reported “0 — Extreme left,” most of them (31) chose “left” when later asked to identify their political ideology using the 5-point scale. These respondents are represented by the highlighted horizontal line straight across the top of the chart.
But what about the 24 other people in France who chose the “0 — Extreme left” option? These respondents are represented by three narrower bands that start at “0 — Extreme left” and then slide down and to the right in the chart. Overall, most of these respondents (18) chose “leaning left.” Far fewer moved to “center” (five respondents) or “right” (one respondent). None of the respondents who answered “0 — Extreme left” on the 7-point scale reported “leaning right” on the 5-point scale.
The full range of patterns between the two scales in France is provided in the next Sankey diagram, with the path of each combination of responses illustrated by a different color.

A few trends emerge in this graph:
- About half of the respondents (53%) who selected the midpoint on the 7-point scale also chose “center” on the 5-point scale, as illustrated by the thickest yellow band connecting “3” to “center.” Among those who chose the midpoint on the 7-point scale but did not choose “center” on the 5-point scale, roughly twice as many placed themselves left of center than right of center: 31% versus 17%.
- Nine-in-ten (90%) of those on the left of the 7-point scale identified as left of center on the 5-point scale as well, as illustrated by nearly all of the blue bands above the midpoint moving to either “left” or “leaning left.” Overall, 7% of those who characterized their ideology as left of center on the 7-point scale moved to “center” on the 5-point scale, while 3% moved to “leaning right” or “right.”
- Around two-thirds of respondents (66%) who placed themselves on the right of the 7-point scale also chose “right” or “leaning right” on the 5-point scale. Surprisingly, more of those who identified as right of center on the 7-point scale identified as “left” or “leaning left” on the 5-point scale (21%) than moved to the center (13%). This is shown by the similarly sized orange and red paths heading to “left,” “leaning left,” and “center.”
- Of the 35 possible response combinations between questions, no respondents in France answered “0 — Extreme left” on the 7-point scale and later identified as “leaning right” on the 5-point scale, or answered “1” and then identified as “center” or “leaning right.”
Cross-national results from the experiment
Sankey diagrams can also be helpful to illustrate and better understand cross-national patterns in our three selected countries. As the next chart shows, several of the broad trends we observed in France are apparent in Spain and the UK as well:

Here’s a closer look at what’s happening in this chart:
- Across all three countries, most respondents who chose the midpoint on the 7-point scale also chose “center” on the 5-point scale (53% in France, 52% in Spain and 59% in the UK). And just as in France, more people moved from the midpoint of the 7-point scale to left of center on the 5-point scale than moved to the right on the 5-point scale.
- In all three countries, the overwhelming majority of those who placed themselves on the left of the 7-point scale also identified as left of center on the 5-point scale (90% in France, 94% in Spain and 89% in the UK).
- There is more variability among those who placed themselves on the right of the 7-point scale. While 66% of those on the ideological right in France also placed themselves on the right of the 5-point scale, the share who did so was lower in both Spain (52%) and the UK (61%). Respondents on the ideological right of the 7-point scale in Spain and the UK were more likely than their counterparts in France to move to the center on the 5-point scale (26% in Spain and 25% in the UK versus 13% in France).
- As was the case in France, a few combinations of responses were not found in Spain and the UK. No respondents in Spain answered “0 — Extreme left” and then “center” or “leaning right,” or, in another combination, “1” and then a right-of-center response. Similarly, in the UK, no respondents first answered “0 — Extreme left” or “1” and then “right.”
As illustrated in the Sankey diagrams, there is general ideological consistency at the individual respondent level between the two survey questions, with only a limited share of people in each country providing apparently contradictory answers. In fact, only 11 of our 2,625 respondents provided the opposite extremes to the two scales (“0-Extreme left” and right or “6-Extreme right” and left). The robustness of these measures across countries suggests that both items can be useful in estimating political ideology. Across countries, our respondents behaved similarly, but not exactly the same. This is reflected in the subtle variability in responses to these two questions that are seemingly measuring the same thing.
Concluding thoughts
Both scales have benefits. A 5-point, fully labeled scale allows respondents to identify with a qualitative description of their political leaning, while a 7-point, endpoint labeled scale provides respondents with more choices to select a position closest to their political ideology. While the two survey questions are different in scale size and wording, respondents across countries answered them in similar patterns, giving us confidence in both when conducting cross-country comparisons.
There are several caveats, however. The experiment relied on relatively small samples that limited our findings in a few ways. For example, we could not conduct robust analyses across all possible answer combinations because some were too infrequent and others nonexistent. And while some respondents answered with “don’t know” or refused to answer at all, the number of people who did so was relatively small, limiting our ability to draw inferences about this group.
Aside from sample size, there are a few other issues we would consider expanding upon in future experiments. For instance, we did not rotate question order to examine whether replying to the first ideology question affected respondents’ answers to the second question or subsequent items. Also, we tested only two response scales, which means we could not assess the merits of other permutations, such as the results of a fully labeled, 7-point scale or a numeric, endpoint-labeled 5-point scale.
Finally, the questions we tested weren’t equivalent. The Center’s standard political ideology question includes the words “extreme” (in the 7-point scale itself) and “center” (in the question stem), but this is not the case in the alternative 5-point scale and associated question. Additional experimental conditions — say, keeping the scale length the same but testing different wordings, or vice versa — would allow us to disentangle these effects.
To dig deeper, it might be useful to look beyond the survey results. It’s possible some respondents were confused when we asked for their political ideology twice, so one way to explore the issue would be to incorporate cognitive interviewing in future experiments. This may help researchers better understand the meaning of survey questions, including questions that ask about the same underlying concept, from a respondent’s point of view.
In the meantime, we plan to use the data from this experiment to further study whether one of these ideology questions is a more accurate or valid measure than the other. Comparing each question with other items asked in our surveys — such as respondents’ political party affiliation or their opinions on highly politicized topics — would provide additional insights, with the help of Sankey diagrams to visualize the results.


